


Thursday, October 20, 2016 11:04:33 AM
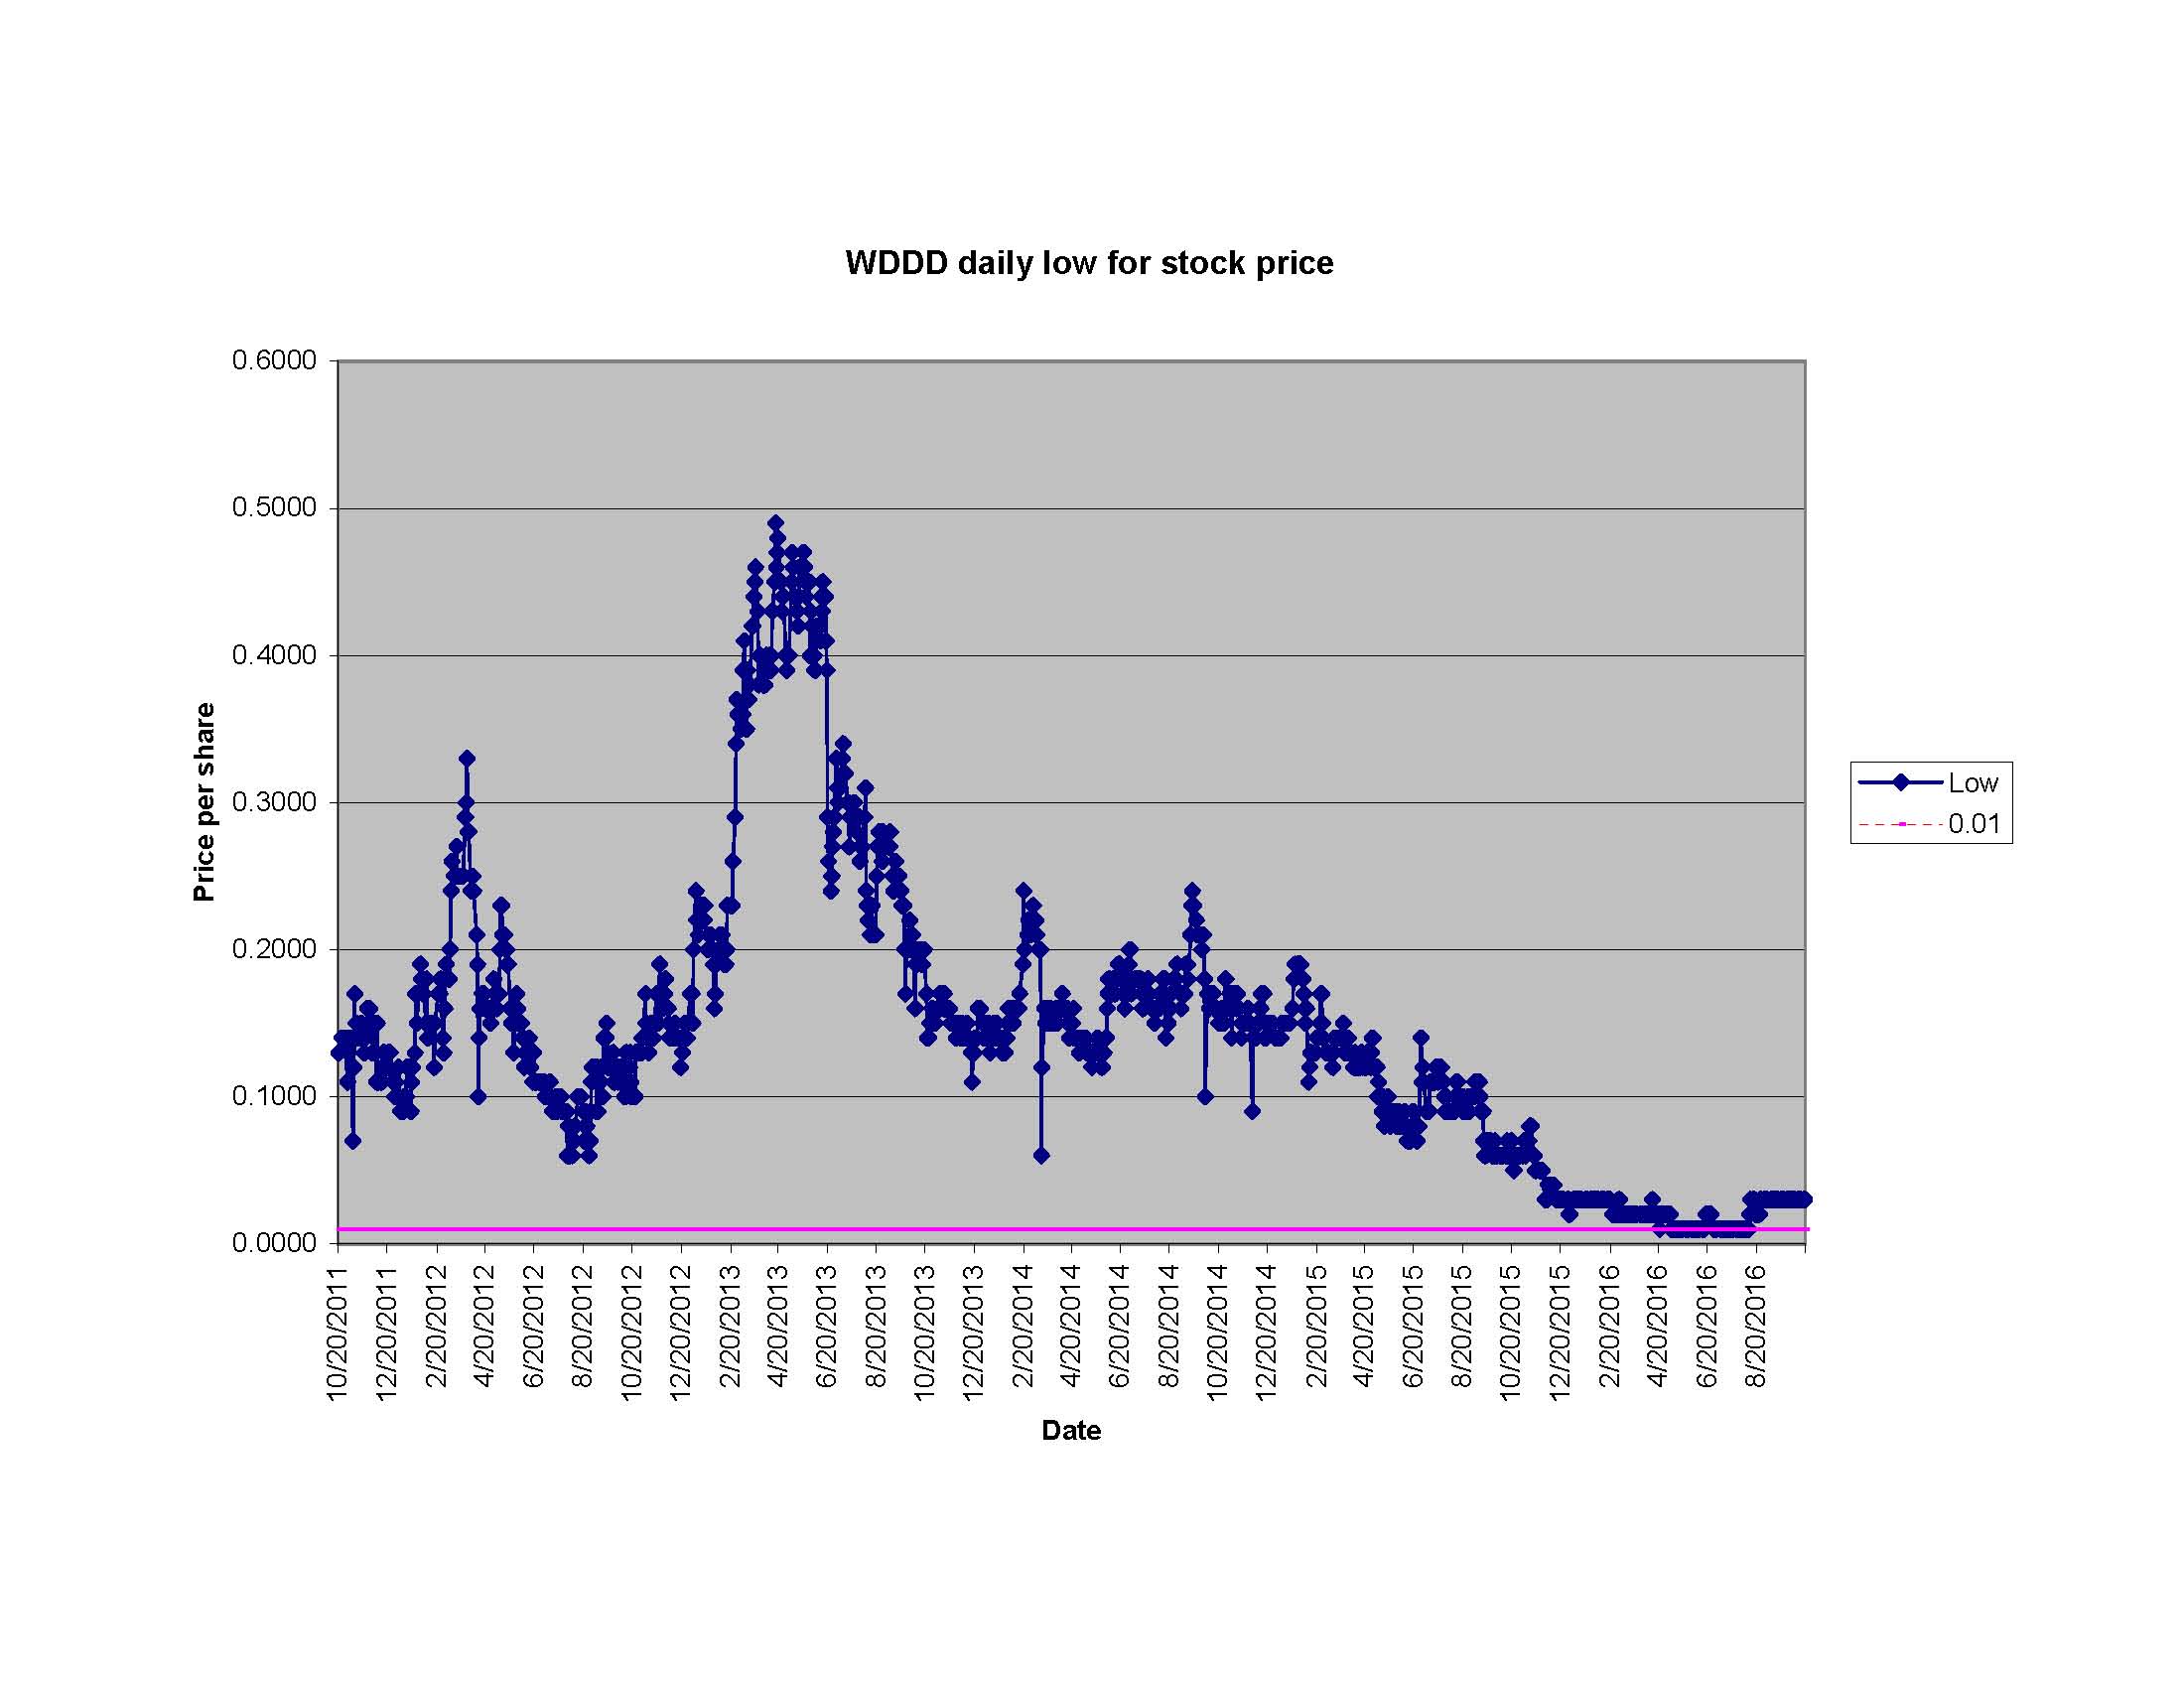
Attached please find a five year chart of the daily lows for WDDD. The data is for 10/20/2011 through 10/19/2016. There are 1,258 trading days of which 63 days had WDDD trading as low or below $0.01 per share.
The blue line shows the daily low for each day.
The red line is $0.01 so one can see when the daily low was at or below $0.01.
The oldest daily trading low at or below $0.01 for WDDD was 04/21/2016 and the most recent was 08/10/2016.
You will note that over time the stock price has trended lower.
Louis J. Desy Jr.
Recent WDDD News
- Form 8-K - Current report • Edgar (US Regulatory) • 12/19/2023 09:30:21 PM
- Form 10-Q - Quarterly report [Sections 13 or 15(d)] • Edgar (US Regulatory) • 08/11/2023 06:34:14 PM
North Bay Resources Announces Successful Equipment Test at Bishop Gold Mill, Inyo County, California • NBRI • Apr 23, 2024 9:41 AM
Epazz, Inc.: CryObo, Inc. solar Bitcoin operations will issue tokens • EPAZ • Apr 23, 2024 9:20 AM
Avant Technologies Launches Advanced AI Supercomputing Network and Expansive Data Solutions • AVAI • Apr 23, 2024 8:00 AM
BestGrowthStocks.com Issues Comprehensive Analysis of Triller Merger with AGBA Group Holding Limited • AGBA • Apr 22, 2024 1:00 PM
Cannabix Technologies to Present Marijuana Breathalyzer Technology at International Association for Chemical Testing (IACT) Conference in California • BLO • Apr 22, 2024 8:49 AM
Kona Gold Beverages, Inc. Prepares for First Production Run Set to Launch May 17, 2024 • KGKG • Apr 22, 2024 8:30 AM

