


| Followers | 679 |
| Posts | 140826 |
| Boards Moderated | 36 |
| Alias Born | 03/10/2004 |
Tuesday, October 18, 2016 12:14:45 PM
By Dana Lyons
* October 18, 2016
Potential price resistance is among several obstacles posing a challenge to the recent rally in Nat Gas.
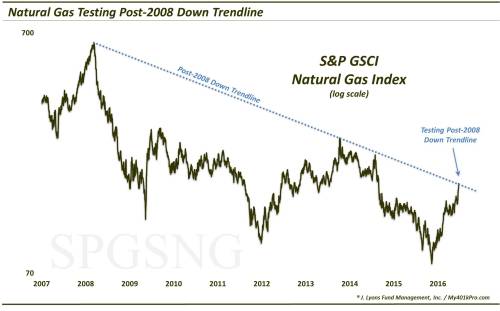
As equity managers, we mostly talk about the equity market. And for the past 8 months, much of that talk has centered around the post-February stock market rally. However, stocks aren’t the only thing that have bounced sharply since early in the year. Many commodities have also rallied, including natural gas. In fact, nat gas has more than doubled since bottoming at the beginning of March (we do not trade futures so that performance is measured by the S&P GSCI Natural Gas Index which closely tracks the commodity – unlike the ETP’s [e.g., UNG] that have obvious tracking issues).
That said, there are a few factors that may present a challenge currently to the rally in natural gas. Not the least of which is price. Specifically, the GSCI Nat Gas Index is bumping up against the Down trendline stemming from its 2008 top and connecting the early and late 2014 tops.
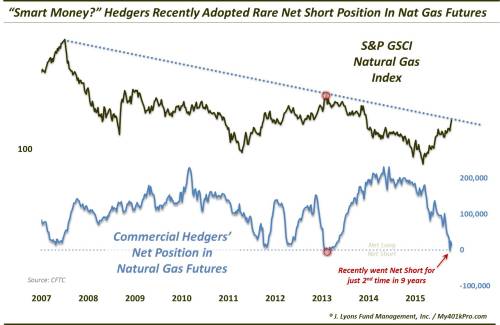
This trendline may present a hurdle for the current extension of the nat gas rally. That is not the only challenge potentially facing it, however. One other red flag comes in the form of positioning in the natural gas futures market. Specifically, according to the CFTC, Commercial Hedgers recently adopted a net short position for just the 2nd time in the past 9 years. The concern is that these Hedgers most often represent the “smart money” once positioning gets to an extreme. Thus, this rare net short position indicates a potential headwind for nat gas prices, at least based on historical behavior.
Early 2014 was the only other time Hedgers went net short in the last 9 years. Nat gas prices peaked immediately and commenced their 2-year ~70% decline. Additionally, other times since 2007 that saw the Hedgers approach a net short position coincided with at least short-term tops, including October 2012, April 2013 and the major, long-term top in 2008.
At least one other red flag for the nat gas rally comes in the way of seasonality. Now, seasonality represents overall historical tendencies and, thus, should not be taken as gospel. However, according to www.sentimentrader.com, on average, by far the best 2 months of the year for natural gas prices are September and October. After that, they tend to peak and the subsequent 4 months have negative average returns, historically.
The rally in natural gas this year has been impressive, including a 20% pop to 2-year highs in just the past 2 weeks. Thus, the bulls are firmly in control. However, at least a trio of obstacles in the form of long-term trendline resistance, futures positioning and seasonality could potentially conspire to extinguish this current leg of this nat gas rally.
http://jlfmi.tumblr.com/post/151982073615/is-natural-gas-rally-about-to-flame-out
• DiscoverGold
Information posted to this board is not meant to suggest any specific action, but to point out the technical signs that can help our readers make their own specific decisions. Your Due Dilegence is a must!
• DiscoverGold
FEATURED Cannabix's Breath Logix Alcohol Device Delivers Positive Impact to Private Monitoring Agency in Montana, USA • Apr 25, 2024 8:52 AM
Bantec Reports an Over 50 Percent Increase in Sales and Profits in Q1 2024 from Q1 2023 • BANT • Apr 25, 2024 10:00 AM
Kona Gold Beverages, Inc. Announces Name Change to NuVibe, Inc. and Initiation of Ticker Symbol Application Process • KGKG • Apr 25, 2024 8:30 AM
Axis Technologies Group and Carbonis Forge Ahead with New Digital Carbon Credit Technology • AXTG • Apr 24, 2024 3:00 AM
North Bay Resources Announces Successful Equipment Test at Bishop Gold Mill, Inyo County, California • NBRI • Apr 23, 2024 9:41 AM
Epazz, Inc.: CryObo, Inc. solar Bitcoin operations will issue tokens • EPAZ • Apr 23, 2024 9:20 AM

