


| Followers | 679 |
| Posts | 140793 |
| Boards Moderated | 36 |
| Alias Born | 03/10/2004 |
Monday, October 03, 2016 8:13:02 AM
* October 3, 2016
Crude oil sits at a critical juncture. Depending on which way it breaks probably decides stocks’ path of least resistance near term.
Last week, OPEC announced its commitment to cutting output to between 32.5 million barrels per day and 33 mb/d. In August, the cartel produced 33.24 mb/d.
Spot West Texas Intermediate crude has come a long way – from $107.68/barrel in June 2014 to $26.05 in February this year to $48.24 last Friday. Brent crude during the period went from $115.71 to $27.10 to $50.03.
OPEC producers are hurting. It is not just the likes of Venezuela, Nigeria and Angola. Even Saudi Arabia, which produced a record 10.673 mb/d in July, is. The last time the 14-member group, with a little over one-third global market share, cut production was during the financial crisis in 2008.
There are no details yet on how the cuts will be implemented. But the important thing is that Saudi Arabia is willing to compromise. Iran in particular is likely targeting pre-sanction market share, not just four mb/d. At first glance, Saudi Arabia seems to be capitulating.
That said, in the grand scheme of things, the planned OPEC cut is not that big of a deal, given the glut. Also last Wednesday, before the OPEC decision, the International Energy Agency said it did not see the oil market rebalancing until late 2017.
When it is all said and done, this may prove to be a life line for U.S. shale oil, which then means glut persists, precisely what OPEC is trying to avoid.
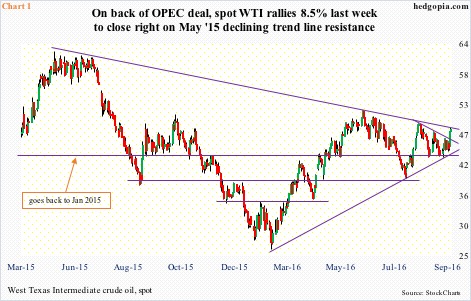
For now, on the back of last week’s deal, spot WTI rallied 5.3 percent on Wednesday – past the August 19th declining trend line – and then another 2.5 percent in the next couple of sessions. The 50-day moving average was recaptured.
But this is just a battle. The war lies ahead.
Last week, spot WTI closed right on a declining trend line drawn from May 2015 (Chart 1). Daily conditions are overbought, but there is room to rally on the weekly chart. A breakout would be important.
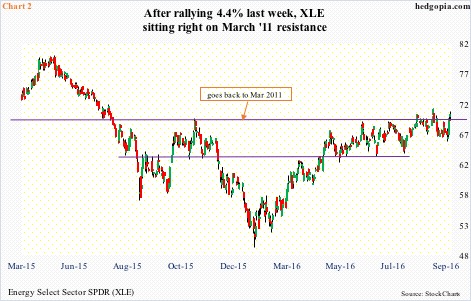
On a related note, mid-September short interest on XLE, the SPDR energy ETF, surged 38 percent period-over-period to 40.5 million – just in time to probably get squeezed. Between Wednesday and Friday last week, the ETF jumped 5.7-percent, closing at $70.67. This approximates an important price point for both bulls and bears going back to March 2011 (Chart 2). Last week’s candle engulfed prior week’s doji.
Once again, as is the case with crude, an XLE breakout can have important implications, at least near term. Sector-wise, energy makes up 7.2 percent of the S&P 500 large cap index – small compared to 21.3 percent for information technology, 14.6 percent for health care or 12.7 percent for financials, but from the perspective of sentiment can have outsize impact now.
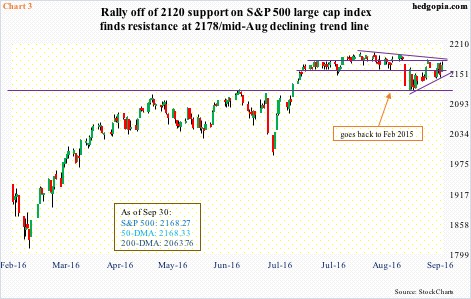
The S&P 500 itself is at a crucial juncture (Chart 3). In July this year, it rallied past 2134.72, an all-time high reached in May 2015. Earlier in the same month, the index broke out of consolidation that had been in place since February 2015, when it first hit 2120.
But the bulls have not been able to build on that breakout. Positively, in the middle of last month, they defended 2120. It has only been a couple of weeks since, but the index has been making higher highs. Negatively, it has been rejected at the 2175-2180 resistance. For the last several sessions, it closed on both sides of the 50-day moving average, with Friday closing right on it.
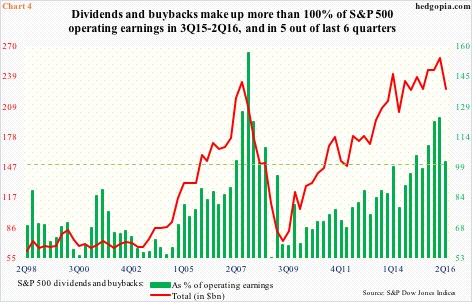
This indecisive action is unfolding even as there are signs buybacks are slowing down. Buybacks have proven to be a bulwark of this bull market. From a low of $24.2 billion in 2Q09 to $161.4 billion in 1Q16, they have come a long way. The 1Q16 peak was the second highest ever after $172 billion in 3Q07; 2Q16 dropped 21 percent quarter-over-quarter to $127.5 billion.
On a rolling four-quarter basis, buybacks still look good, with 1Q16 at $585.4 billion versus $589.4 billion in the prior quarter. But it is the trend that counts. There is good reason to believe companies are simply chewing more than they can swallow.
In five of the last six quarters, S&P 500 companies spent more in dividends ($98.3 billion in 2Q16) and buybacks combined than they earned out of operations ($222.8 billion in 2Q16), with 2Q16 at 101.4 percent (Chart 4).
In this context, a breakout in crude oil can help, helping longs possibly build on a fresh crossover between 10- and 20-day moving averages on the S&P 500.
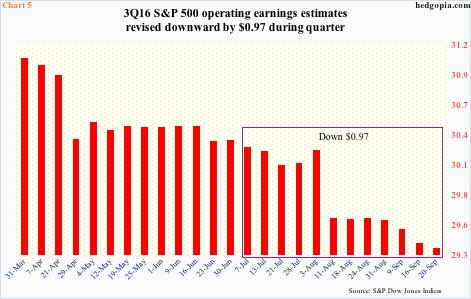
The 3Q16 earnings season begins next week in earnest, and the customary downward revision has taken place, with estimates having dropped $0.97 to $29.36 just since the quarter started (Chart 5). Not to mention the consensus was expecting $34.61 in 1Q15. In at least the last six quarters, except for 2015, the S&P 500 has rallied in the first month of the quarter, as earnings get reported.
But this hunky-dory scenario likely falls flat on its face if crude oil does not cooperate. Traders had a full weekend to think over the OPEC deal, and they can easily conclude that last week’s reaction was much ado about nothing.
A lot is riding on crude.
http://www.hedgopia.com/as-goes-crude-oil-so-go-stocks-near-term/
• DiscoverGold
Information posted to this board is not meant to suggest any specific action, but to point out the technical signs that can help our readers make their own specific decisions. Your Due Dilegence is a must!
• DiscoverGold
Axis Technologies Group and Carbonis Forge Ahead with New Digital Carbon Credit Technology • AXTG • Apr 24, 2024 3:00 AM
North Bay Resources Announces Successful Equipment Test at Bishop Gold Mill, Inyo County, California • NBRI • Apr 23, 2024 9:41 AM
Epazz, Inc.: CryObo, Inc. solar Bitcoin operations will issue tokens • EPAZ • Apr 23, 2024 9:20 AM
Avant Technologies Launches Advanced AI Supercomputing Network and Expansive Data Solutions • AVAI • Apr 23, 2024 8:00 AM
BestGrowthStocks.com Issues Comprehensive Analysis of Triller Merger with AGBA Group Holding Limited • AGBA • Apr 22, 2024 1:00 PM
Cannabix Technologies to Present Marijuana Breathalyzer Technology at International Association for Chemical Testing (IACT) Conference in California • BLO • Apr 22, 2024 8:49 AM

