


Wednesday, September 21, 2016 8:59:16 AM
Today we initially didn't see semi-static big b/a imbalances to the buy side for extended periods as had been the case the last week or so. That changed at 12:53 as the bid quantity consistently outweighed the offer quantity going forward through 14:57. Then it began varying, with the EOD volatility beginning to set up I guess.
We got a flat two-cent wide trading range today on reducing volume.
The conventional TA, excluding the reducing volume, suggests nothing but weakness. My unconventional stuff suggests no strength, but also no weakness.
I'll go with my unconventional stuff and say sideways on low volume for now.
There were no pre-market trades.
09:30-11:11 opened the day with a 155 buy for $1.35. Then came 9:33's 8K $1.34, 9:34's 5K $1.3399, 9:35's 2.2K $1.34->$1.3316->$1.35, 9:37's 200 $1.35, and 9:38's ~1K $1.34. That began very low/no-volume $1.33/4. B/a at 9:40 had 2.5K:5.6K $1.33/5. Volume was interrupted by 9:49's 9.6K $1.3399.
B/a at 9:56 was 4.8K:800 $1.33/4, 10:15 5.2K:600 $1.33/4, 10:30 4.6K:1K $1.33/4, 10:44 14.4K:12K $1.33/4. Volume was interrupted by 10:48's 11.3K $1.3350/$1.34->$1.33 and 10:49's 10.7K $1.3350->$1.34.
B/a at 11:11 was 15.2K:5.6K $1.33/4. The period ended on 11:11's 9.3K $1.3350/$1.34.
11:12-13:51 Began very low-volume $1.34/$1.3450 (almost all $1.34 after the first couple minutes) on 11:12's 7.1K $1.3350/$1.34->$1.3450 and 11:14's 9.6K $1.34/$1.3450->$1.34. B/a at 11:23 was 2.2K:8K $1.34/5 but trade continued $1.34 until 11:34's 700 $1.35->$1.34 widened the range to $1.34/5. Most trades still went $1.34 or $1.34xx. B/a at 11:35 was 2K:8.3K $1.34/5, 11:52 3.9K:7.3K $1.34/5. Volume & price was interrupted by 12:19's 2K $1.34->$1.3350->$1.34 and 12:20's ~3.9K $1.34.
B/a at 12:24 was 5.6K:6.3K $1.34/5. 12:35's 100 tried to open the spread to $1.34/5 but it failed to have that effect.
At 12:36 b/a was 6K:6.8K $1.34/5. Volume was interrupted by 12:47's 7K $1.3450/$1.35.
B/a at 12:53 was 4.8K:4.2K $1.34/5, 13:14 10.3K:3.5K $1.34/5. The period ended on 13:51's1.1K $1.34.
13:52-16:00 began very low/no-volume $1.33/4 on 13:52's 2.5K $1.34->$1.3350. B/a at 13:57 was 21.1K:4K $1.33/4, 14:06 19.7K:5.6K $1.33/4, 14:19 17.7K:4.9K $1.33/4, 14:33 16.8K:5.2K $1.33/4, 14:57 11.5K:8.4K $1.33/4. Volume was interrupted by 15:16's 10.6K (incl 10K $1.33 blk) $1.33->$1.3350.
B/a at 15:19 was 8.9K:5.6K $1.33/4. Volume was shifted to more high/medium-volume by 15:37's 5.3K (incl $1.3362 x 5K) $1.33/$1.3362 and 15:41's 16.3K (incl 10K $1.34 blk) $1.33->$1.3350->$1.34. B/a at 15:43 was 13.1K:3.2K $1.33/4, 15:49 13.9K:1.7K $1.33/4. 15:56 began most trades going $1.33/$1.3350. B/a at 15:54 was 12.8K:1.3K $1.33/4. The price tried to close high when 15:56's 9.5K tried to get $1.34 range going into the close but couldn't pull it off. The period and day ended on 15:59's 1.4K $1.3350>$1.34->$1.3350 and 16:00's 400 1.33.
There were no AH trades.
Excluding the opening and closing trades (didn't qualify), there were 10 larger trades (>=5K & 3 4K+) totaling 66,477, 24.70% of day's volume, with a $1.3382 VWAP. The count and percentage are reasonably normal. A couple "larger larger trades" and a VWAP slightly above the day's $1.3374 suggests a little optimism by some retailers or some covering buys by shorters. Combined with the very flat day (2 cent spread) the latter seems very likely and the former less so.
If the were shorters doing covering buys it looks like most of it was done in the first period with the first period - highest buy percentage and lowest VWAP and about a third of day's volume. My guess would be that the latter two periods with higher VWAPs and lower buy percentages and the two "larger larger trades" were the optimistic retailers seeing price didn't plummet and deciding to take a cautious long position. Of course, both shorters and retailers could have been sitting on the low-ball bids all day just waiting so there's really no way to know who did what when or how.Ending Period Period Period __Per. Trade_ Period_ % Day_ Per. End
Period Volume Low High _Dollar Val._ VWAP___ Volume Buy ~%
11:11 86734 $1.3300 $1.3500 $116,051.42 $1.3380 32.22% 64.38% Incl 09:33 $1.3400 8,000 09:34 $1.3399 5,000
09:49 $1.3399 9,600
10:48 $1.3400 4,533 4,000
13:51 71546 $1.3350 $1.3500 $95,971.46 $1.3414 26.58% 45.99% Incl 11:14 $1.3401 4,100 13:50 $1.3400 6,244
16:00 108223 $1.3300 $1.3500 $144,400.43 $1.3343 40.21% 41.31% Incl 15:16 $1.3300 10,000 15:37 $1.3362 5,000
15:41 $1.3400 10,000
On the traditional TA front, movements were:
On my minimal chart I had a couple egregious typos yesterday. I said { I think we'll stabilize or even rise tomorrow. With our history though it will be hard to close above the longer-term rising support, so that one will likely confirm a break down. I do believe we'll close above the $.34. } LoL! I got that right! But I meant to say { ... I do believe we'll close above the $1.34 } and if I had said that I would have been wrong because we closed at $1.33.__Open_ ___Low_ __High_ _Close_ Volume_
Today -3.57% 0.76% -3.57% 0.00% -37.51%
Prior 0.00% -5.71% -0.71% -5.00% 78.58%
I also said { Having said that, if I'm wrong, not an unusual occurrence, we could head to $1.4/5. } That should have been { ... we could head to $1.24/5. }
Regardless of those - an effect of me running late and having divided attention - while discussing breaking the two support points with a rising volume suggesting increasing strength to the down side, I got one part right when I said { However, the intra-day behavior, but for the 11:16-ending period, does not support the volume's suggestion of increasing strength down. The 11:16-ending period was the cause and I think it's a one-off. This is supported by some of my unconventional stuff below.
I think we'll stabilize or even rise tomorrow. With our history though it will be hard to close above the longer-term rising support, so that one will likely confirm a break down. } We did stabilize for sure - a two cent spread for the day on reduced volume.
Anything useful on today's minimal chart? Only that reducing volume seems consistent with a short sideways move starting, supported by a tight spread, and our range stayed between the $1.32/4 support mid-point, along with the close there, and had a weak attempt to break above $1.34. The experimental 13-period Bollinger band limits are still falling and converging as the upper limit falls more rapidly than the lower limit, also suggesting we'll do a short sideways move for now ... sans a catalyst PR of course.
On my one-year chart the 10-day SMA is already below the 50-day and the 20-day should get there tomorrow, sans a catalyst PR. The 50-day has shown it's first weakening and without a rise back to around the $1.40 level will continue to weaken. It was only a few days ago, when the closings were 7-10 cents higher, I was still saying it would continue to rise a couple weeks. If we don't rise, all three will be falling.
Of the oscillators I watch, RSI, MFI (untrusted by me), and momentum, are flat and Williams %R is almost so. Full stochastic and Williams %R rose slightly. Accumulation/distribution weakened. RSI, Williams %R, MFI (untrusted by me), and full stochastic are deep in oversold. MFI is at it's lower bound while Williams %R and full stochastic are very near it. Momentum, accumulation/distribution and ADX-related are below neutral.
The 13-period Bollinger limits, $1.2496 and $1.6735 ($1.2559 and $1.7256 yesterday) are falling and converging. We are trading around and below the declining mid-point.
All in, nothing positive on the conventional TA front other than falling volume. This at least says there's little strength in the down trend and offers the possibility of a pause and reversal. But I don't see a cause for a reversal right now - even momo and day traders likely don't see opportunity in the behavior right now. This suggests continued falling volume and lack of any strength to the up side.
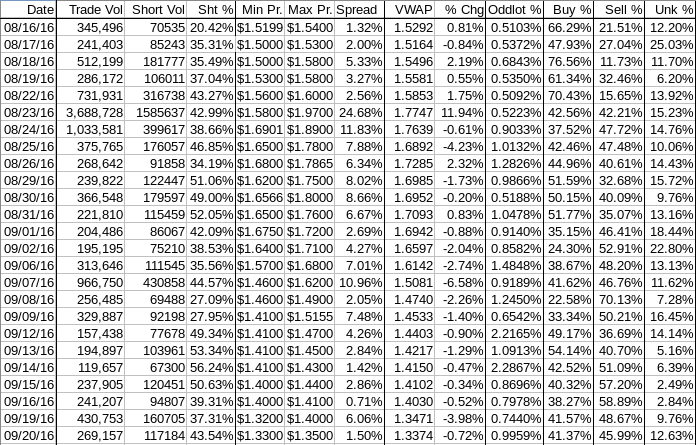
Percentages for daily short sales and buys did not move in the same directions. Short percentage rose to just below my desired upper limit (needs re-check) and buy percentage fell marginally - essentially flat. Buy percentage remains in a range suggesting weakness will continue and short percentage is where one would expect for a "normal" generally sideways day with lots of MM involvement and little intra-day broker involvement.
The spread is suggesting a near-term consolidation has begun. I expect it won't last long.
The VWAP's last twenty-four readings deteriorated again, going from 17 negatives and 7 positives to 18 and 6 respectively. Change since 08/16 is -$0.1917, -12.54%, and the averages of the rolling 24-day period seen in the last few days (latest first) continue worsening and are -0.5054%, -0.4416%, -0.2697%, -0.2275%, -0.1731%, -0.1117%, -0.1021%, -0.0088%, 0.2908%, and 0.4090%.
All in, no sign of strength here. But there's also no sign of increasing weakness ... yet anyway.
Bill
Join the InvestorsHub Community
Register for free to join our community of investors and share your ideas. You will also get access to streaming quotes, interactive charts, trades, portfolio, live options flow and more tools.

