


Friday, August 19, 2016 9:28:57 AM
Near-term bullish based on both conventional TA and my unconventional stuff. This is bolstered by the reappearance of the odd intra-day behavior of the big semi-static b/a buy imbalance and very good buy percentages throughout most of the day. Add in a close at resistance after spending almost all day there and above, $1.54/5, and rising volume that is up into "big" for this symbol, around 500K.
The day began with an open low, $1.50, and immediately started crawling up, eventually topping out on 10:21-:23's ~84.2K at $1.58. A drop back down to $1.54 occurred on 10:26-:32's ~80K. After that the rest of the day was flattish $1.54/5 and the b/a began acting like it did before when buy percentages were 6x%+ - offers were apparently inexhaustible with bids running around 10K-15K and offers running ~ <= 1K or so. But it didn't matter, as attested by the buy percentage which rose steadily from 69% at 10:32 to ~77% at 15:45.
Being we've seen this particular movie before I suspect a few days again of this sort of behavior with the peculiar b/a behavior and strong buy percentages and VWAPs again creeping upward. Of course, with yesterday's suspicion we go down I now may have become a contrary indicator.
There were no pre-market trades.
Just prior to open b/a was 1.5K:500 $1.48/51
09:30-09:55 opened the day with a 451 sell for $1.50. Then came 9:31's b/a of 1.6K:10K $1.50/2, 9:32's 100 $1.51, 9:34's b/a of 12.1K:10.6K $1,51/2, 9:36's 750 $1.5155, 9:40's 100 $1.52, 9:41's b/a of 13.3K:10.9K $1.51/2, 9:44's 110 $1.52, 9:47-:48's 11.5K $1.52, 9:49's b/a of 3.2K:2.5K $1.52/3, 9:49's 500 $1.53, 9:53's 13.3K $1.53, 9:54's 1.5K $1.53->$1.54, and the period ended on 9:55's 8.8K $1.5350->$1.54->$1.5399->$1.5350->$1.54.
9:56-10:23 first began verylow/no-volume $1.53/4 through 10:06 on 9:56's 250 $1.53. B/a at 9:57 was 1.6K:1.3K $1.53/4, 10:01's was 5.9K:3.8K $1.52/3. The the game changed as a big run higher began hitting 10:08's 2K $1.54/5, 10:09's ~20.3K $1.54/6, 10:21's 40.1K $1.55/8, and the period ended on 10:23's 43.1K $1.56/8.
N.B. Note the spread on the above trades - folks were trying to exit as the bullish folks just kept buying. Buy percentage moves:
10:24-10:32 did a small retrace on 10:24's 400 $1.56, 10:26's 1.2K $1.57->$1.56, and the period ended on 10:28-:32's 78.8K $1.56->$1.55->$1.5450->$1.55->$1.5450->$1.54->$1.54/5. That showed buyers were still aggressive as price fell, giving b/s movements of:09:45: buy 62.87%, sell 30.51%, unk 06.62% on 1.5K
09:55: buy 88.75%, sell 03.18%, unk 08.07% on 37.2K
10:00: buy 80.13%, sell 08.69%, unk 11.18% on 41.8K
10:15: buy 72.92%, sell 09.02%, unk 18.06% on 127.4K
10:33-16:00 began very low/no-volume $1.54/5, biased to much more at $1.55, on 10:33's 400 $1.54. B/a at 11:03 was 13.4K:2.2K $1.54/5, 11:11 14.1K:2.2K $1.54/5. Volume was interrupted by 11:11's 10.4K $1.55->$1.5499->$1.5440->$1.55. B/a at 11:21 was 15.3K:900 $1.54/5, 11:38 14.4K:700 $1.54/5. Volume was interrupted again with 11:46's 25.K $1.55. B/a at 11:56 was 14.3K:800 $1.54/5. Volume was again interrupted by 12:13's 9.5K $1.5410/$1.55 and 12:51's ~11K $1.545/$1.55. B/a at 12:53 was 4K:11.8K $1.54/5, 13:03 13.9K:12.2K $1.54/5, 13:25 14.7K:10.9K $1.54/5, 13:53 14.8K:1.2K $1.54/5, 14:08 14.9K:900 $1.54/5, 14:23 14.6K:1.4K $1.54/5, 14:51 15K:600 $1.54/5, 15:00 14.4K:700 $1.54/5, 15:50 15.2K:500 $1.54/5. The period and day ended on 15:59's ~2.9K $1.53 and 16:00's 541 sell for $1.54.10:23: buy 66.74%, sell 13.95%, unk 19.31% on 217.6K
10:30: buy 68.06%, sell 15.34%, unk 16.59% on 263.4K
10:32: buy 69.94%, sell 13.73%, unk 16.33% on 298.0K
There were no AH trades.
In/Excluding the opening and closing trades (didn't qualify), there were 14 larger trades (>=5K & 3 4K+) totaling 112,017, 21.87% of day's volume, with a $1.5492 VWAP. Pretty normal for the day's volume. A good sign is we also had a reasonable number of "larger larger trades". As above, this is all very similar to the recent days when we had high buy percentages and b/a stuck with a big buy imbalance most of the day.
As mentioned, buy percentage stayed high and b/a imbalance big to the buy side was static most of the day.
 Ending  Period  Period  Period __Per. Trade_ Period_ % Day_ Per. End
 Period  Volume     Low    High _Dollar Val._ VWAP___ Volume Buy ~%
  10:23  216498 $1.5000 $1.5800   $335,570.47 $1.5500 42.27% 66.74% Incl 09:48 $1.5200 5,000 09:53 $1.5300 4,500
                                                                         10:09 $1.5500 8,000 10:14 $1.5500 7,187
                                                                         10:14 $1.5500 8,620 10:21 $1.5600 6,210
                                                                         10:23 $1.5677 5,000
  10:32   80407 $1.5400 $1.5700   $124,627.54 $1.5500 15.70% 69.94% Incl 10:30 $1.5500 12,500 12,500
                                                                         10:31 $1.5500 4,400 10:32 $1.5500 8,600
  16:00  211813 $1.5400 $1.5515   $328,099.60 $1.5490 41.35% 76.48% Incl 11:46 $1.5500 12,500 12,500 14:54 4,500
On the traditional TA front, movements were:
I especially like the volume having such a big rise on a big day up when we moved through $1.54 and stayed above most of the day. This suggests we will confirm a break above resistance tomorrow.__Open_ ___Low_ __High_ _Close_ Volume_
Today -1.32% 0.00% 3.27% 2.67% 112.18%
Prior 0.00% -1.31% -0.65% -1.96% -30.13%
On my minimal chart, yesterday I said, among other things, { Combined with the intra-day behavior now returning to a more normal M.O. I believe the near-term will finally produce the small re-trace I had been expecting. }
Well, big fail again. We saw the return today of the very high buy percentages and the b/a with a mostly static large b/a imbalance to the buy side, very similar to what was seen beginning 8/8 and running for about five days when VWAP went from 8/5's 1.4739 to 8/16's 1.5292. This produced a mostly flat trading day at $1.54/5, again similar to what was previously seen.
That would suggest we should expect a similar pattern and will confirm a break through $1.54 tomorrow.
But since I'm now apparently a contrarian indicator ...
Two days back I said { What all that means to me is we should soon exit short-term consolidation to the up side. } and then yesterday, after an apparent big fail, said { An obvious fail there unless "soon" comes into play with another push up instead of going in the direction currently suggested on this chart. Again, the falling volume offers that possibility but I would expect at least a couple consecutive days of weakening in both price and volume before that would happen. }
Can I have a Mulligan please? I got it partly right when I mentioned the falling volume offering the possibility we would push up and I used the word "soon"?
Anyway, a down open, flat low, higher high, close at resistance and volume up 112.18% into what's a high range for this symbol paints a rosy picture of what should follow. Add in that the experimental 13-period Bollinger band has rotated to raising the lower limit and we began pushing the upper limit today. Since we tend to "push" the limits for a few days I expect a confirm of a break out tomorrow.
On my one-year chart the 10-day SMA got a boost from the higher range and rotated from falling to rising and is just a bit less than a penny from crossing above the 20-day again. If our range holds here it will rise for two weeks. The 20-day has another five days of rise if range holds. The 50-day will be rising for an extended period, maybe 25 days or so if our range holds.
I expect our range to rise more so all these averages should have time to get to 10-day above 20 above 50. With the 200-day falling we could also see the 50-day cross above the 200-day.
The oscillators I watch, which all weakened yesterday, all improved but for full stochastic, which weakened. MFI (untrusted by me) is just below overbought and RSI, momentum, Williams %R, full stochastic, and ADX-related are above neutral.
The 13-period Bollinger limits, $1.4471 and $1.5498 ($1.4452 and $1.5533 yesterday). I'll call the mid-point flat for today.
All in, near-term bullish based on both the conventional TA stuff and the fact that the intra-day behavior mimics what was seen in our recent rise. I expect it will continue for another day or two, also mimicking that prior behavior.
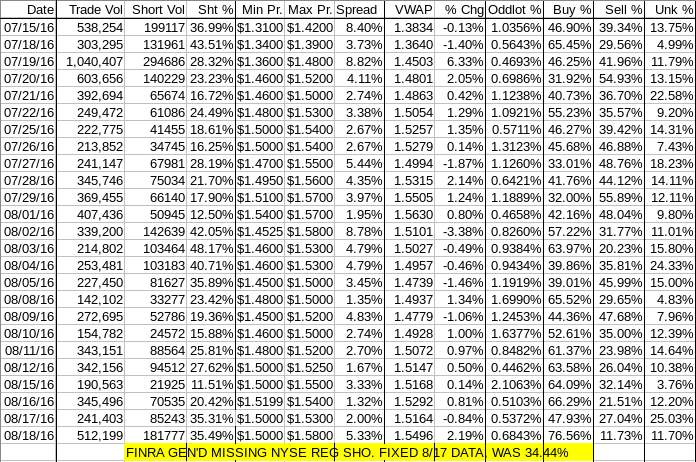
Percentages for daily short sales and buys moved in the same direction, good, and the short percentage remains in the lower part of my desired range (needs re-check), even better. By now you know the buy percentage is strongly into the area of sustainable appreciation again after only a one-day break. I'll have to watch out for this "one-day break" so I don't get fooled again.
The spread widened into a range that suggests more of a move should be expected near-term. Direction is up.
The VWAP's last twenty-four readings again improved from 9 negatives and 15 positives to 8 negatives and 16 positives. Change since 07/15 is $0.1662, 12.02%, and the averages of the rolling 24-day period seen in the last few days (latest first) are 0.4903%, 0.3934%, 0.4850%, 0.4435%, 0.4761%, 0.4766%, 0.2227%, 0.4407%, 0.3111%, and 0.5993%.
All in, near-term bullishness seems most likely.
Bill
Join the InvestorsHub Community
Register for free to join our community of investors and share your ideas. You will also get access to streaming quotes, interactive charts, trades, portfolio, live options flow and more tools.

