


Friday, July 15, 2016 10:25:38 AM
Still consolidation, not mildly bullish, now leaning mildly bearish, as we see only MM control of the market at investor apathy leaves the MMs in control to eke out a living.
There were no pre-market trades.
Just before the open b/a was 100:800 $$1.35/40 and went to 100:46.7K $1.36/40 at the bell.
09:30-11:57 opened the day with a 766 sell for $1.37, and 500 more for $1.37, followed by 9:31's 200 $1.40, 9:32's 20 $1.3625, 9:33's 10 $1.3999, and b/a went 400:52.3K $1.36/40, 9:38 went 1.3K:7.2K $1.36/9, 9:39's did 25 $1.39 and b/a at 9:41 was 600:8.3K $1.36/9, 9:47 1.9K:9.8K $1.36/9. 9:40-:50's no trades was followed by 9:51's & :52's 3 & 40 $1.3601, and 9:55's 100 $1.39. 9:56-10:12's no trades, with b/a initially at 2.5K:9.3K $1.36/9 and at 10:04 400:8.5K $1.37/9, was followed by 10:13/:14's 100 each $1.39, b/a at 10:20 1.4K:3.2K $1.38/9, 10:15's five odd lots for 11 shares $1.3801->$1.39, 10:21's 73 $1.3801, and 10:28's 100 $1.39. B/a at 10:29, 2K:2.6K $1.38/9, began 10:29-:37's no trades, during which b/a was seen at 10:36 2K:2.6K $1.38/9. 10:38 did 500 $1.3854 and b/a went 2K:2.7K $1.38/9, 10:42 did 100 $1.39 and b/a went 2.3K:18.1K $1.39/40, 10:44 did ~2.8K $1.39, 10:47 did 100 $1.40 and b/a became 2.1K:18.1K $1.39/40, 11:03 did 200 $1.40, 11:05 did 260 $1.3917, 11:16 did ~2.8K $1.3950->$1.39->$1.40, 11:18 did 12K (greater than 100% of all prior volume) $1.40 (10K)->$1.39 (2K) and b/a became 700:22.3K $1.39/40.
Finally 11:25 onward began some regular very low/no-volume $1.39/40. The period was ended by 11:57's 100 $1.39.
11:58-13:11, after two no-trades minutes, began very low/no-volume $1.38/9 on 12:00-:01's ~35.6K, including a 25K $1.38 block to end, $1.3878->$1.3850->$1.39->$1.38. At 12:05 b/a was 5.9K:600 $1.38/9, 12:30 5.6K:1.6K $1.38/9, 12:50 7.6K:4.1K $1.38/9. The period ended on 13:11's 100 $1.39.
13:12-16:00, after four no-trades minutes, on 13:16's ~27.9K, incluidng a 25.9K $1.38 block, $1.38. B/a at 13:24 was 4.2K:5.7K $1.38/9, 14:30 5.5K:2.9K $1.38/9, 14:58 ~5.4K:42.2K $1.38/9, 15:45 6.2K:42K $1.38/9. The period and day ended on 15:59's 852 $1.39->$1.38 and 16:00's 200 sell for $1.38.
There were no AH trades.
Excluding the opening and closing trades (didn't qualify), there were 6 larger trades (>=5a & 2 4K+K) totaling 75,233, 56.00% of day's volume, with a $1.3832 VWAP. The larger trades count is still low but percentage of day's volume is quite high, a big change from the past couple days. Note the combination of VWAP, percent of day's volume and buy percentage change of the 13:11 and subsequent periods. I think this combined with the larger trades metrics offer support of a long-standing observation of mine: open high and sell (naked short for the MMs) into the strength (likely day traders?) and then move price lower to do covering buys (as day traders hit the bids?).
I'll never know. Could be completely "innocent" trader/investor behavior cutting losses as the MMs move price down possibly triggering stops.
On the traditional TA front, movements were:Ending Period Period Period __Per. Trade_ Period_ % Day_ Per. End
Period Volume Low High _Dollar Val._ VWAP___ Volume Buy ~%
11:57 30427 $1.3700 $1.4000 $42,431.49 $1.3945 22.65% 72.27% Incl 11:18 $1.4000 10,000
13:11 55130 $1.3800 $1.3900 $76,213.26 $1.3824 41.03% 37.60% Incl 12:01 $1.3800 25,000 12:13 4,600 5,400
16:00 47719 $1.3800 $1.3900 $65,970.82 $1.3825 35.52% 32.59% 13:16 $1.3800 25,933 15:15 $1.3890 4,300
Very interesting is that the open and close movements track closely to the VWAP movements yesterday and today: -0.76% and 0.74%. This might warrant further investigation.__Open_ ___Low_ __High_ _Close_ Volume_
Today 0.74% 1.48% 0.00% 0.73% 57.83%
Prior -0.73% -0.74% 0.00% -0.72% -69.79%
On my minimal chart we got our first close above the medium-term descending resistance (descending green line). Another close above confirms a breakout. It should be noted that the breakout was accomplished via the falling resistance combined with a sideways price move, not by a price push up and through the line. This leaves me still calling consolidation even if we get a confirmation unless a price move up is seen shortly. Being a Friday tomorrow, I would be surprised to see that, especially in light of the very flat intra-day behavior we've been seeing.
We also continue to trade at and above the short-term rising support (not shown on your chart yet) that began subsequent to 7/6. With generally low volume, long flattish intra-day behavior, and patterns generally suggestive of manipulated prices for the benefit of the MMs (really only feasible in very low-volume environments), not price behavior associated with a "healthy" market, I'm suspicious of the rise.
This is buttressed by the flat tops the last few days - $1.40 - in spite of rising lows. Someone may be painting a perfect picture of compressing range suggestive of a coming breakout. It may happen but I would be surprised if it held very long.
Real volume would change that and I suspect the alert sites will be the catalyst if the top starts to move substantially.
I'm not ignoring Bulkowski's stuff - none of my TFH stuff negates that. I believe he just observes the effects of many things and reports the results without concern for the underlying causes. His projected results could well appear regardless of true market behavior or MMs' manipulation.
On my one-year chart the 20-day SMA continued declining and we saw the 10-day go flat. The 50-day got a very small up-tick.
The oscillators I watch, yesterday all weakened but for full stochastic, saw RSI and full stochastic improve. Momentum, Williams %R, ADX-related and MFI (untrusted by me) all weaken. This essentially continues yesterday's behavior. I think this is a red flag as we didn't do the common flip-flop associated with uncertainty during consolidation.
The 13-period Bollinger limits, $1.2802 and $1.4260 ($1.2787 and $1.4305 yesterday) continue converging with a slightly rising mid-point as the limits are rapidly approaching a very narrow spread now. This suggests a substantial move nearing.
All in, I'm still with consolidation but, as with yesterday, sans the mildly bullish bias.
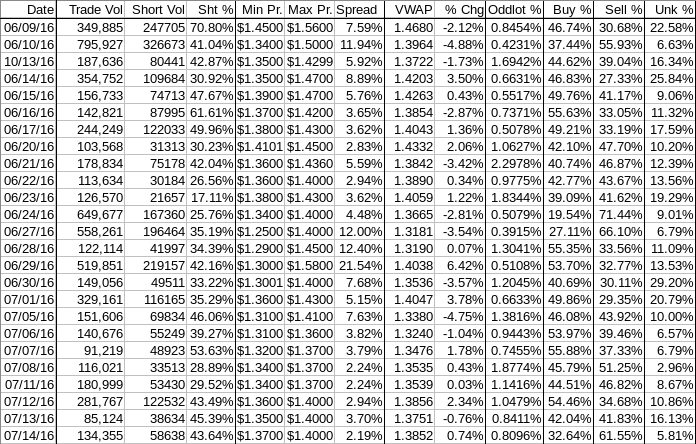
Percentages for daily short sales and buys moved in the same direction, suggesting normalcy, and the short percentage remains at the top of my desired range (needs re-check). Unfortunately, the buy percentage continued its march further below what's needed for sustained appreciation. This is a big negative when combined with short percentage remaining relatively high.
The spread continues in ranges associated with consolidation and tells us nothing now - seven consecutive days in this sort of range combined with intra-day flattish behavior and no movement in price range is likely just a hallmark of MM bots controlling a low-volume scenario to scrape profits.
The VWAP's last twenty-four readings went more positive at ten negatives and fourteen positives. Change since 06/09 is -$0.0828, -5.64%. I expect this percentage to remain low for some time now.
All in, nothing really positive here other than stability, as indicated by the cessation of severe drops in the VWAP. The buy percentage is the biggest negative but we can't attribute it to market sentiment - it's more of a lack of sentiment as I think we are seeing investor/trader apathy demonstrated, which leaves the market in the control of the MMs.
As always, much is experimental and should be treated as such.
Bill
Join the InvestorsHub Community
Register for free to join our community of investors and share your ideas. You will also get access to streaming quotes, interactive charts, trades, portfolio, live options flow and more tools.

