


Saturday, May 21, 2016 7:27:08 PM
Today was an open low, a climb steadily to the day's high of $1.50 by 11:24, a fall mildly to $1.46 by 12:06, a rise up to begin a flattish $1.47/9 through the end of the day, interrupted by mostly $1.47/8 13:42-14:47 and 15:29's $1.49/$1.50, and closed on a 689 sell for $1.45 after 15:58 drooped as low as $1.45.
It's interesting that 15:58 traded ~23.4K, ~10.5% of the day's volume, to produce this drop. My best guess for this is day traders, but I don't know of course.
With no catalyst in sight and no known economic tailwind developing, as the dollar has again reversed and is rising, I have to ask what cause the early rise and sustained elevated intra-day price and buy percentage (well above 50% 1:00-15:45). You already know what I suspect, don't you? It's Cowan and Co. moving price around in a low-volume environment, making it easy to do so, so that CPST can rake in more ATM money. But how does that account for the buy percentage behavior? Shorters covering? I'll never know.
All things considered though, and regardless of the ATM, suspicions and possible short covering, I wouldn't be surprised to see price hang in around this level, or even improve marginally until the next resistance level.
There were no pre-market trades.
09:30-10:05 opened the day with a 710 sell for $1.41, did 9:31-:34's no trades, 9:35's 450 $1.4100/$1.4130, 9:44's 100 $1.41, 9:46's 250 $1.4199, 9:49's 100 $1.42, 9:52's 700 $1.4001, and 10:05's 500 $1.4068/$1.42 ended the period.
10:06-10:25 began a very low/no-volume rise with 10:07's 100 $1.43, did 10:11's 100 $1.44, began flattish on 10:18-:19's 225 $1.44->$1.4334, 10:21-:22's 839 $1.44->$1.43, and 10:24-:25's 200 $1.44->$1.43 ended the period.
10:26-10:41, after six no-trades minutes, began a very low/no-volume $1.42/3 on 10:32-:34's ~1.7K $1.42->$1.43->$1.4181->$1.43 and ended on 10:41's 100 $1.43.
10:42-11:43, after a no-trades minute, began an intermittent variable-volume push up on 10:43-:44's ~20.3K $1.43->$1.45->$1.44, hit 10:51's $1.45/6, 10:56's ~12.7K $1.46->$1.49->$1.47, hit 11:24's $1.4915/$1.50, and went sideways to end the period on 11:43's 5K $1.50.
11:44-12:22, after a no trade minute, began moving lower on 11:44's 2K $1.49->$1.48, did 11:48-50's ~8.3K $1.48->$1.47, and bottomed on 12:03-:07's ~7.9K $1.4735->$1.46. After a short mostly low-volume sideways $1.46, did a short rise on 12:14's 600 $1.4650->$1.47, and 12:22's 6K $1.48->$1.49 ended the period.
12:23-13:40 began a very low/no-volume $1.48/9, interrupted by 13:09's 184 $1.47, and ended on 13:40's 100 $1.49.
13:41-14:55, after one no-trades minute, began very low/no-volume $1.47/$1.48 on 13:42's 100 $1.4750. The trend was interrupted by 1:16's 346 $1.47/9, 14:48's 100 $1.49, and 14:48's 100 $1.49. 14:55's 100 $1.48 ended the period.
14:56-15:56 did a step down to very low/no-volume $1.47/9 on 14:56's ~31K $1.48/9 and 14:59's 430 $1.47. The trend was interrupted by 15:29's 500 $1.49/50. 15:56's 100 $1.49 ended the period.
15:57-16:00, after a no-trade minute, did 15:58's ~23.5K $1.48->$1.45->$1.46 and 16:00's 689 sell for $1.45 ended the period and day.
There were no AH trades.
Excluding the opening and closing trades (didn't qualify), there were 11 larger trades (>=5K) totaling 72,955, 32.57% of day's volume, with a $1.4770 VWAP.
On the traditional TA front, movements were:Ending Period Period Period __Per. Trade_ Period_ % Day_ Per. End
Period Volume Low High _Dollar Val._ VWAP___ Volume Buy ~%
10:05 2910 $1.4001 $1.4200 $4,103.00 $1.4100 1.30% 27.53%
10:25 3464 $1.4201 $1.4400 $4,941.46 $1.4265 1.55% 30.97%
10:41 1850 $1.4181 $1.4300 $2,632.12 $1.4228 0.83% 33.58%
11:43 87138 $1.4300 $1.5000 $128,500.40 $1.4747 38.90% 56.89% Incl 10:44 $1.4400 11,900 10:56 $1.4900 6,915
11:07 $1.4701 4,900 11:20 $1.4830 5,000
11:38 $1.4999 5,000 11:43 $1.4999 4,080
12:22 30030 $1.4600 $1.4900 $44,365.56 $1.4774 13.41% 55.76%
13:40 8590 $1.4700 $1.4900 $12,753.80 $1.4847 3.83% 56.14%
14:55 26493 $1.4700 $1.4900 $39,122.19 $1.4767 11.83% 53.88% Incl 14:08 $1.4764 6,500
15:56 37882 $1.4701 $1.5000 $56,155.05 $1.4824 16.91% 48.21% Incl 14:56 $1.4800 6,800 $1.4900 6,060
16:00 24132 $1.4500 $1.4800 $35,587.03 $1.4747 10.77% 47.30% Incl 15:58 $1.4800 10,800 5,000
Time for a new minimal chart I guess ...__Open_ ___Low_ __High_ _Close_ Volume_
Today -0.70% 1.46% 4.90% 2.11% 70.31%
Prior 1.43% -1.43% -2.05% -1.39% -34.06%

On my minimal chart I yesterday noted { ... The last five days are making a rounding, and now falling, highs and lows pattern on declining volume the last two days. That volume pattern is the only good thing in that it says there's not a lot of strength (yet!) in the move lower ...} and { We've got a "southern doji" candlestick (open and close same price with a long tail at the in (at end of?) a down trend) which is supposed to be a bullish reversal sign. Bulkowski finds it's random, actually reversing only 52% of the time. }
Today seems to have confirmed the lack of strength in the observed move lower and we also got the dice to roll in our favor today as the "random" move was higher. Further, it occurred on rising volume, suggesting there could be strength in the move. However, bear in mind that the volume is still not strong at ~224K as our 10 average yesterday was ~337.7K.
Considering that last item I can't see today's rise in volume as yet suggesting strength in the move up but it also does not deny the possibility of strength.
Note that our close is very near/on the rising support/resistance (lower rising orange line) as has been the case so many times. One could conclude that the trend is for price to "follow" this rising line. However, with all but today's challenges being rejected by failing to confirm a break above, I still view it as a rising resistance that continues to hold and is demonstrating strength of resistance. Today's close on the line can only be viewed as another case of the resistance holding.
Note also that the high very nearly touch the upper limit of the Bollinger band and retreated. This presents a second suggestion that the rising orange line will again hold as it's right around the Bollinger's mid-point, which is falling. Pushing price range above trend, whether measured by a line or a more sophisticated construct such as the Bollinger Band, can be expected to be difficult. With two forms of resistance presented, the line and the Bollinger Band mid-point, I suspect we won't easily move higher. This has been the case most of the time.
So from this chart, sans other information, I would still be leaning negative near-term.
On my one-year chart, first some potentially good news. My long-term descending resistance is below today's close. If tomorrow is the same it demonstrates the line will not be resistance - it likely it just aged out.
The 10-day SMA was nearly flat, $1.4320 vs yesterday's $1.4310, thanks to a small rise in the close. If close tomorrow remains >= $1.38 we'll remain flat or rise, depending on the close. The 20-day SMA continues to fall. The 50-day SMA will continue flattish another two or three days if the close holds the current position.
The oscillators I watch only momentum and accumulation/distribution did not improve marginally. These two weakened. Only Williams %R and MFI (untrusted by me) are above neutral. Just below neutral, and likely to get there sans a drop in price range, are full stochastic and RSI.
The 13-period Bollinger limits, $1.3636 and $1.5087 ($1.3583 and $1.5232 yesterday) continue converging with a falling mid-point. As I've been saying, I expect a break soon. Was today the start of it? Hard to say. Volume rose but is still low. However, as noted below, daily short percentage is back within normal range and buy percentage moved back up to our "normal", which is just below what I believe is needed for sustained appreciation. It's not great but is an improvement.
All in, there is a suggestion of possible near-term positive moves, partially offset by a couple negatives. Whether they can sustain is always the pressing question and sans a trend established I'm not willing to hazard a guess on that yet.
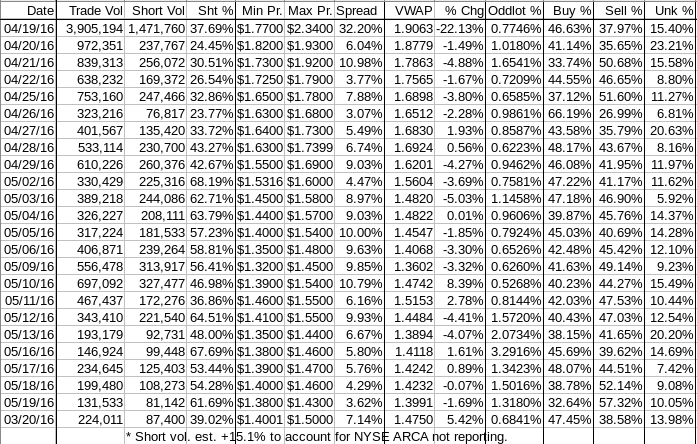
Percentages for daily short sales and buys moved in opposite directions, not normal. However, short percentage moved to the low end of my desired range (needs re-check), which is good, especially after the string of abnormally high readings. The buy percentage moved, after two consecutive days of abnormally low readings, back to our "normal". It's not high enough to suggest sustained appreciation but it is high enough that it doesn't strongly suggest a negative move either.
The spread widened and is a bit wider than I would like, but produced by an intra-day move up which sustained, to a predominate degree such that I can't really see it as a negative. Add in that we're not in a well-defined down trend and it seems even less concerning.
VWAP movement now has fifteen negative and seven positives in the last twenty-two readings. Today's movement was the largest since 5/10's ~8.4%. Unfortunately that move produced only one following rise before moving negative again. There is a difference though ...
5/10's move was produced by, among other things, a PR about a C-800 sale, the buy percentage was only ~40% and the short percentage was just above my preferred range. OTOH, volume was better (in fact an outsized move), suggesting that rise had some strength and possibly some longevity. That didn't work out, of course.
I said at the time { ... I note that as with so many recent occurrences there's a "sell into strength effect" as the shares trade at very high relative price while buy percentage is horrid ...} and I finished up with { ... Adding in the volume and PR response, I think we've got another day or two in which we don't fall much. Maybe even a bit more up-side, but I expect our resistance is strong. Might only see a positive move in the VWAP getting another day or two of increase. }
Today's move was accompanied by more favorable short and buy percentages and a volume rise in a reasonable range. Moreover, today was "buy into strength" as intra-day buy percentage held up very well most of the day.
Don't misunderstand - I'm not saying all is rosy or even that these readings are all that good, just that they are better and seem to me to be less susceptible to the "pop and deflate" that we saw on the 5/10 results.
I do, as always, have a suspicion of manipulation. See my comments above about that.
With today having no artificial bump from a PR, a better buy
All in, I'm not negative about today's stuff. Am I positive about them? Um, NYET! But there is a possibility that we do get a near-term strengthening.
As always, much is experimental and should be treated as such.
Bill
Join the InvestorsHub Community
Register for free to join our community of investors and share your ideas. You will also get access to streaming quotes, interactive charts, trades, portfolio, live options flow and more tools.

