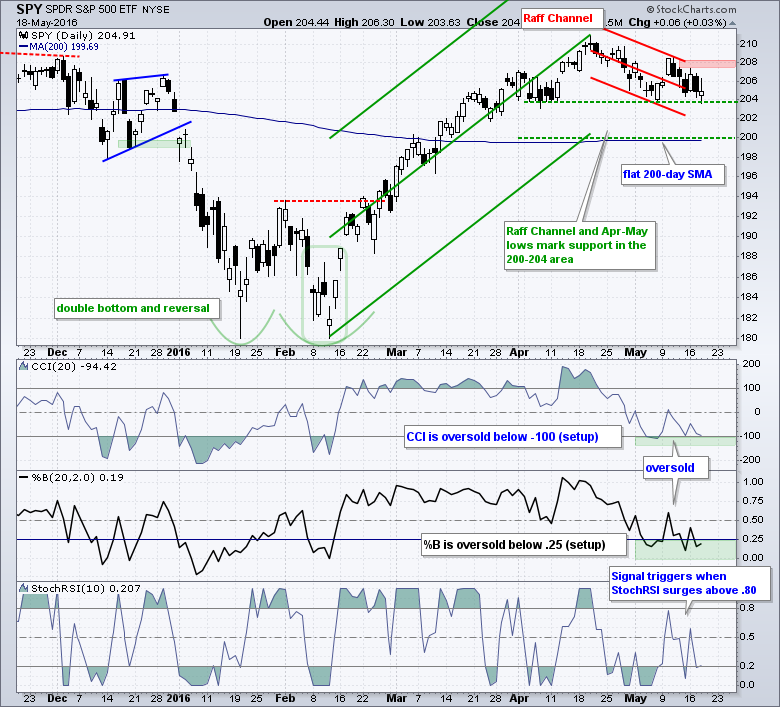
The first chart shows SPY firming with a spinning top candlestick near first support in the 204 area. The short-term trend is down right now with a Raff Regression Channel defining this downtrend. While a break below 204 would be "negative", it would just be a continuation of the short-term downtrend. I view the 200-204 area as a support zone and would be on guard for a reversal in this zone.
Register for free to join our community of investors and share your ideas. You will also get access to streaming quotes, interactive charts, trades, portfolio, live options flow and more tools.
 News
News  Market Data
  Discover