


Saturday, May 07, 2016 10:20:14 AM
Today was a bit unusual in that we opened "high" ($1.44, 2 cents below yesterday's close) and actually dropped as low as $1.40 though 9:56 before we got the typical early push up, this time hitting $1.46 at 10:17, peaking on 10:37's $1.48. With the stage set, 10:48 started the trek lower, hitting $1.45 at 10:55, $1.43 at 11:03, $1.42 at 11:30, and $1.41 at 11:32. The was a flattish $1.41/4 (interrupted by 11:44's~5.4K $1.42/6) through 13:09. That was followed by a long erratic fall, hitting $1.40 at 13:10, $1.39 at 13:25, $1.38 at 13:34, $1.36 at 13:38, and $1.35 at 14:56. But no worries mate! we of curse immediately get a helping hand as we recovered to $1.37/8 the next minute, got a boost from $1.38-> $1.43 in three minutes on 15:30-:32's ~8.4K. 15:38's ~8.1K completed the paint job with a top at $1.44. Of course, as with recent patterns, we dropped back to as low as $1.39 (15:54-:55's ~31.6K) and 15:59 gave us $1.40. The close was a 284 4 cent rise from there, meaning we closed only 2 pennies down from yesterday.
Congrats to our unseen mal/beneficent cohorts on their consistent stealthy and efficient "management" of our market!
There were no pre-market trades.
09:30-09:56 opened with a 4,050 sell for $1.44 and another 60 at the same price. Then came an unusual fall instead of push up with 9:35's 3.3K $1.43/4, 9:38-:39's ~3.7K $1.45->$1.43, 9:42's 220 $1.43, 9:51's 250 $1.43, and 9:55-:56's ~4.2K $1.42->$1.4030 set the initial intra-day low to end the period.
09:57-10:14, after a no-trades two minutes, began a mostly low-volume wide sideways $1.41/3 on 9:58's 1K $1.42, 9:59's 5K $1.41/2 and then went mostly low, and some no, volume $1.41/3 and ended the period on 10:14's 120 $1.42.
10:15-10:22, after a no-trade minute, did a quick rise doing 10:16's 8.4K $1.42, 10:17's 3.5K $1.44->$1.46, and 10:18's 3K $1.42->$1.46. Then 10:19-:22's low-volume flat $1.46 ended the period.
10:23-10:34 moved to a lower range on 10:23-:25's ~1.7K $1.46->$1.45->$1.42 and began low/medium-volume $1.42/4 and ended on 10:34's 400 $1.44.
10:35-10:58 moved back up on 10:35's ~8.9K $1.44->$1.46 and 10:36's ~1.5K $1.43->$1.46. Very low-volume $1.4550-$1.48 began and 10:48 moved it to $1.455x-$1.47, and 10:58's 400 $1.45 ended the period.
10:59-11:26, after a no-trade minute, stepped lower on 11:00-:03's ~6.8K $1.45->$1.44->1.43 and began mostly no volume and very low-volume $1.43/4, interrupted by 11:08's 185 $1.4551, and ended the period on 11:26's 3.1K $1.44.
11:27-12:06, after a no-trades three minutes, began a quick drop lower on 11:30's ~6.7K $1.43-$1.42, 11:31-:32's ~3.6K $1.42->$1.41, and then did medium/no-volume $1.41/3 through 11:38, did 11:39-:43's no-trades, 11:44's ~5.4K $1.42->$1.46, 11:45's 119 $1.44, 11:52-:55's ~1.3K $1.43->$1.41, 11:57's 1.1K $1.41/4, 11:58-12:05's no trades, and 12:06's 150 $1.44 ended the period.
12:07-13:06, after a five minutes no trades, did 12:12's 10.1K $1.43/4, 12:13-:22's low/no-volume $1.43/4, 12:23's ~6.9K $1.44, 12:24-:33 very low/no-volume $1.44, 12:34-:54's almost no trades $1.43, and 12:55-13:06's very low/no-volume $1.42/3, ending the period on 13:06's 4.1K $1.42/3.
13:07-13:36, after three no-trade minutes, began dropping on 13:10's ~11.2K $1.42->$1.40 (new low), did 13:11's 10K $1.40, did 13:12-:25's low/medium-volume $1.40/2 (mostly $1.40), did 13:26's 700 $1.40->$1.39 (new low), 13:27-:33's low-volume $1.39/$1.40, and 13:34-:36's ~33.3K $1.38->$1.37 (two new lows) to end the period.
13:37-14:55, after a no-trade minute, did 13:38's ~38.6K $1.38->$1.36 (new low) -> $1.44 (Whoop! 8 cent rise!) and began very low-volume $1.40/$1.4099 through 13:42, did 13:43's 2.1K $1.39/$1.42, and 13:44-:47's very low/no-volume $1.39/$1.40. 13:48-14:10 was a very low/no-volume high-volatility $1.38/$1.42 time, interrupted by 14:02's ~14.5K $1.39/$1.42. 14:11 narrowed the range to a very low/no-volume $1.39/40, interrupted by 14:22's ~8.2K $1.39/$1.40, and 14:55's 2K $1.39 ended the period.
14:56-15:27 began with 14:56's ~34K $1.38-$1.35->$1.37 (new low), 14:57's ~12.2K $1.37/8 and did 14:59-15:27's low-volume $1.37/8 to end the period on 15:27's ~2K $1.37/8.
15:28-15:53, after two no-trades minutes, began EOD volatility when it did 15:30's $1.38/9, 15:31-:33's ~9K $1.39->$1.43 (4 cent rise), 15:38's ~8.1K $1.41/4, and began 15:39-:53's low-volume $1.40/1, and did 15:47-:53's $1.43/4->$1.42 to end the period.
15:54-16:00 continued the EOD volatility when did 15:54's 19.3K $1.41->$1.40->$1.42, 15:55's 12.3K $1.42->$1.43->$1.39->$1.41, 15:59's 500 $1.40, and end the period and day with 16:00's 284 sell for $1.44.
There were no AH trades.
Excluding the opening and closing trades (didn't qualify), there were 17 larger trades (>=5K & 3 4K+) totaling 127,888, 31.43% of day's volume, with a $1.4030 VWAP.
On the traditional TA front, movements were:Ending Period Period Period __Per. Trade_ Period_ % Day_ Per. End
Period Volume Low High _Dollar Val._ VWAP___ Volume Buy ~%
09:56 16955 $1.4030 $1.4500 $24,254.12 $1.4305 4.17% 36.57%
10:14 12383 $1.4100 $1.4400 $17,586.36 $1.4202 3.04% 51.14%
10:22 15700 $1.4200 $1.4600 $22,403.33 $1.4270 3.86% 43.53% Incl 10:16 $1.4200 6,300
10:34 4400 $1.4200 $1.4500 $6,301.10 $1.4321 1.08% 44.70%
10:58 18025 $1.4301 $1.4800 $26,074.15 $1.4466 4.43% 48.88%
11:26 13789 $1.4300 $1.4551 $19,851.25 $1.4396 3.39% 50.83%
12:06 21498 $1.4100 $1.4600 $30,629.42 $1.4248 5.28% 44.97%
13:06 26013 $1.4200 $1.4400 $37,336.58 $1.4353 6.39% 52.36% Incl 12:12 $1.4400 6,198 12:23 $1.4398 5,513
13:36 64328 $1.3736 $1.4210 $89,454.24 $1.3906 15.81% 46.51% Incl 13:10 $1.4000 4,197 13:11 $1.4000 5,000
13:34 $1.3800 8,900
14:55 92794 $1.3600 $1.4400 $130,489.11 $1.4062 22.81% 44.28% Incl 13:38 $1.3799 5,000 $1.4400 24,560
14:02 $1.4000 10,000 14:22 $1.3900 4,072
15:27 61444 $1.3500 $1.3800 $84,161.07 $1.3697 15.10% 44.39% Incl 14:56 $1.3500 10,000 $1.3700 5,000
14:56 $1.3800 5,900 14:57 $1.3800 6,048
15:53 24520 $1.3800 $1.4400 $34,642.66 $1.4128 6.03% 43.98%
16:00 32384 $1.3901 $1.4400 $45,490.90 $1.4047 7.96% 42.52% Incl 15:54 $1.4101 4,100 7,200
15:55 $1.3901 9,900
Time for a new minimal chart because price penetrated that new rising potential support I mentioned a few days back.__Open_ ___Low_ __High_ _Close_ Volume_
Today -2.04% -3.57% -3.90% -1.37% 28.26%
Prior -1.34% -2.78% -1.91% 0.69% -2.76%
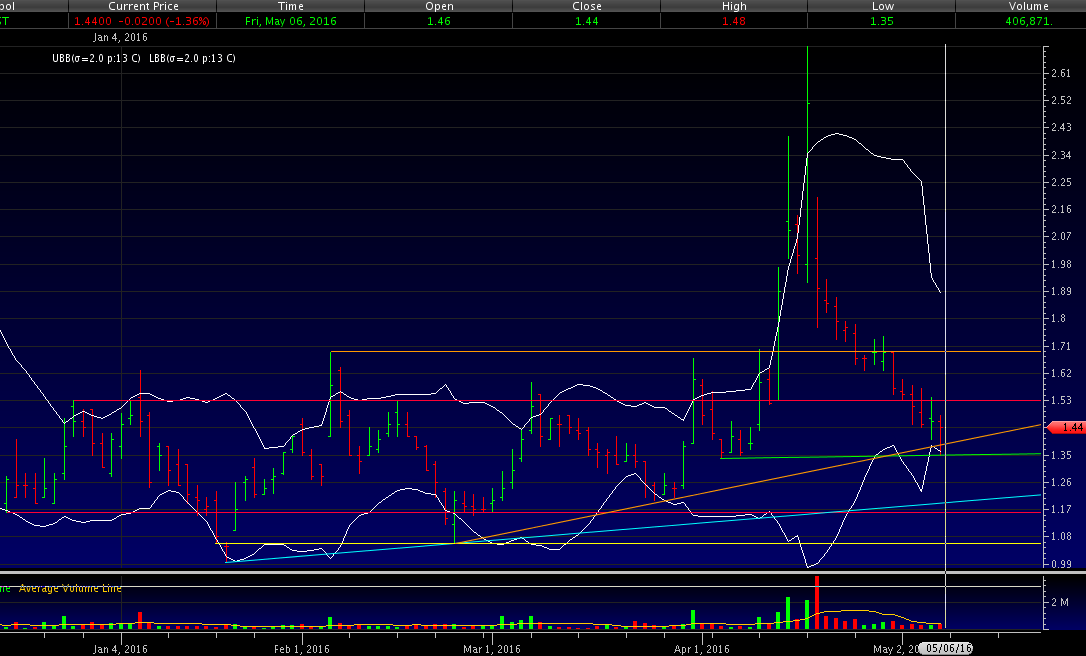
Note the lower open, low, high and close combined with increasing volume. Also not that our low penetrated the new potential rising support (lower rising orange line). Fortunately, so far anyway, we closed above that line and so conventional TA says this acted as support and we haven't broken down yet.
Ignore the green line for now - it's there just in case we later seem to start a potential head & shoulders pattern. It seems unlikely ATM as "symmetry" of the left and right shoulders is one of the attributes and that is looking unlikely.
Anyway, the combinations on this chart suggest more near-term downside is likely since the volume increase was not sufficient to suggest an end of trend.
On my one-year chart the 10-day SMA continues to decline. Yesterday I noted { If we hold our range it will begin to flatten some in the next couple days. I'm not betting on holding our range though. } Our range and close were both lower and I believe we will continue lower and the 10-day SMA will begin to accelerate it's decline as higher prices fall off the tail.
Yesterday I said { The 20-day looks to have a few more days left in it's rise, depending on how fast or price range declines, if it does so. } Price did decline and the "few days" is reduced to one day, at most, if price range declines as I expect.
The 50-day SMA rate of rise should continue a slow rise - maybe another week or so at best - unless our price range tanks big-time.
The oscillators I watch had MFI (untrusted by me) marginally improved again, accumulation/distribution switched from marginally weakened to marginally improved, Williams %R had a larger improvement, and full stochastic continued it's marginal improvement. RSI switched from marginally improving to marginally weakening, as did momentum, and ADX-related continued weakening. We still have oversold readings on MFI, Williams %R and full stochastic and all others are well below neutral.
The 13-period Bollinger limits, $1.3605 and $1.8871 ($1.3811 and $1.9374 yesterday) continue converging due to the much more rapid decline of the upper limit vs. the lower limit. Not that now both have begun falling and the mid-point will be rapidly falling going forward sans some major move upward, which seems unlikely ATM.
I think it's time to recall that my long-term descending resistance is starting to come into range that warrants watching it - it could soon start to have effect. Currently it's ~$1.72 and dropping ~$0.037/day.
All in, only the oscillators in oversold offer hope of a stop of the descent but that's a weak hand to play with all things considered. A better bet would be that as we drop out of the $1.40 range "they" push price back up, maybe with aid of a timely PR, so that any room left in the ATM facility could be used.
I remain bearish in my near-term outlook.
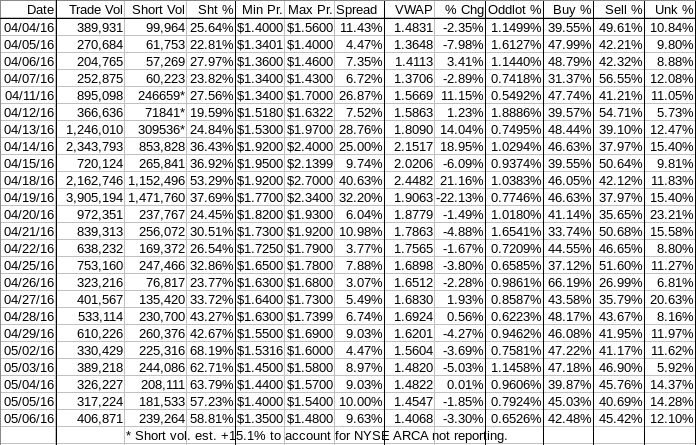
Percentages for daily short sales and buys moved in opposite directions again with the short percentage moved further above my desired range (needs re-check) and the buy percentage drops further below what I think is needed for sustained appreciation.
I remind that I need to check to see if Nyse/ARCA is reporting daily shorts via FINRA/NYSE TRF facility. I've been applying an adjustment which could be giving high readings if those volumes are being reported.
The spread remains quite wide and suggests further weakness since we are in a down trend. Moreover, it was produced by or typical early high, 10:37, followed by a long drop establishing multiple new intra-day lows, with very little recovery until the typical volatility of the last half-hour appeared. The intra-day was atypical only in that th earliest move was down before starting the rise to the day's high.
VWAP movement has now given us ten negative moves in the last thirteen readings.
Substantially increased volume on a day like to day is a big negative, suggesting the down trend still has strength.
All in, nothing positive here today.
As always, much is experimental and should be treated as such.
Bill
Join the InvestorsHub Community
Register for free to join our community of investors and share your ideas. You will also get access to streaming quotes, interactive charts, trades, portfolio, live options flow and more tools.

