


Tuesday, April 26, 2016 1:49:25 PM
Still looks negative to me, but continued decline in volume and improvement in two of my unconventional metrics suggests we may be nearing a bottom. A couple others suggest we've still a way to go - volume and short percentage specifically. Conventional TA has nothing positive to add, other than hope based on volume and two oscillators entering oversold.
I wouldn't hang my hat on that - the hat would likely hit the floor shortly.
There were five pre-market trades totaling 1,700 $1.78-$1.79.
09:30-09:41 opened with a 7,296 sell for $1.76 and traded as high as $1.78 on another 1,462, ending at $1.77. Then steps up began with 9:32's 4.6K $1.77->$1.76-$1.78 followed by 9:33-:36's ~1.6K $1.77->$1.79, 9:37-:40's no trades, and 9:41's ~3.6K $1.77 ended the period.
09:42-10:04 began a sideways high/medium-volume $1.73/6 with 9:42's ~16.3K $1.75->$1.73 that ended on 10:04's 850 $1.75/6.
10:05-10:35, after a no-trades two minutes, began a mostly very low/no-volume $1.73/5 with 10:07's 10K $1.75->$1.73 and ended the period on 10:35's 500 $1.74.
10:36-11:54, after a no-trades minute, began a variable volume, but mostly medium/low with some high volume through 11:00, $1.74/6. At 11:01 it became a very low/no-volume $1.75/6 and ended the period on 11:54's 1.2K $1.75.
11:55-13:00 began another very low/no-volume sideways $1.74/6 with 11:55's 3.6K $1.75->$1.76->$1.74 and ended the period on 13:00's 100 $1.75.
13:01-13:03, after a no-trade two minutes, did ~151.8K $1.75->$1.79->$1.76, including trades of $1.75 x 66,683, $1.78 x 42,360, and $1.79 x 15,770. But there were so many trades that average trade size was 2,663. This minute represented 47.27% of all prior volume and 23.8% of the day's total volume.
13:04-14:32 started another very low/no-volume sideways $1.76/7 through 13:25, dropped on 13:26-:31's 5.8K to $1.75/6, and 13:37's 2K began a very low/no-volume step up to hit 13:51's 19.2K $1.77/8, 14:25's 7.1K $1.78/9, and ended the period on on 14:32's 175 $1.78.
14:33-16:00 began a very low-volume slow declining trend with 14:33's ~15.3K $1.78->$1.75 and 14:34/:35's 1.8K recovery to $1.77->$1.78. $1.76 was hit at 14:52 and after 15:05's ~10.8K $1.76/8 dropped again to 15:23's 6.3K $1.75. 15:24's 1.7K recovery to $1.76/7 started the last long flattish mostly low volume into the close. The period ended on 16:00's 1.3K $1.77.
There were six AH trades totaling 10.1K $1.78->$1.74, the last being another suspicious one because it was very late again and far from both the close and the other AH trades. Likely telling the early action again tomorrow.
Including the opening trade (closing didn't qualify), there were 19 larger trades (>=5K & 5 4K+) totaling 230,185, 36.07% of day's volume, with a $1.7598 VWAP. Excluding those trades, there were 18 larger trades totaling 222,889, 34.92% of day's volume, with a $1.7598 VWAP.
N.B. The larger trades 13:01-:03 skewed the larger block percentage heavily. Regardless, this is a strong negative indicator when you consider the VWAP of the day was $1.7863 and these larger blocks' VWAP were $1.7663, possibly indicating heavy selling preceding this period and these blocks covering MM, or others', shorts as price declined sufficiently to make covering buys attractive.
On the traditional TA front, movements were:Ending Period Period Period Per. Trade_ Period_ % Day_ Per. End
Period Volume Low High Dollar Val. VWAP___ Volume Buy ~%
09:41 23126 $1.7570 $1.7900 $40,899.24 $1.7685 3.62% 24.19% Incl 09:30 $1.7600 7,296
10:04 113196 $1.7300 $1.7600 $196,994.36 $1.7403 17.74% 25.83% Incl 09:42 $1.7300 5,800 09:48 $1.7301 6,522
09:57 $1.7500 9,500
10:35 47633 $1.7250 $1.7500 $82,612.97 $1.7344 7.46% 28.06% Incl 10:07 $1.7300 9,900
11:54 102960 $1.7401 $1.7600 $180,326.37 $1.7514 16.13% 38.54% Incl 10:39 $1.7500 4,747 $1.7501 4,747
11:00 $1.7500 6,000 $1.7500 9,600
11:32 $1.7501 4,650 $1.7500 4,650
13:00 34172 $1.7400 $1.7600 $59,897.29 $1.7528 5.35% 41.41%
13:03 151782 $1.7500 $1.7900 $268,096.19 $1.7663 23.78% 44.82% Incl 13:03 $1.7900 6,800 15,770 $1.7800 42,360
13:03 $1.7500 66,683
14:32 65534 $1.7500 $1.7900 $116,191.66 $1.7730 10.27% 46.48% Incl 13:51 $1.7800 5,000
16:00 85161 $1.7500 $1.7800 $150,182.19 $1.7635 13.34% 44.66% 15:05 $1.7600 10,270 15:11 $1.7700 4,890
15:53 $1.7699 5,000
19:56 10100 $1.7400 $1.7800 $17,858.00 $1.7681 1.58% 45.07%
N.B Note that the "official low is $1.73. Using that figure the low movement would be 0.00% rather than the actual -0.29%.__Open_ ___Low_ __High_ _Close_ Volume_
Today -4.35% -0.29% -6.77% -1.12% -23.96%
Prior -1.08% -4.95% -0.52% -3.24% 31.51%
On my minimal chart the volume keeps falling, but is still too high to suggest a bottom is quite near, while the low held pretty steady with the open, high and close falling noticeably. We are quite close to challenging the $1.67-$1.70 potential support (orange line). I would like to think the volume suggests we have stopped dropping but I just don't see it yet.
On my one-year chart the SMAs continue to see the 10,20 and 50-day rising and should continue for a while longer even if we get some more small drops in the trading range. Larger drops would negate that, of course.
The oscillators I watch all continue to weaken and money flow, MFI (untrusted by me), and full stochastic are in oversold territory.
The 13-period Bollinger limits, $1.1472 and $2.4035 ($1.0778 and $2.4099 yesterday) continues the convergence began yesterday but the upper limit has no begun to drop. The mid-point is still rising as the lower limit rate of rise exceeds the upper limit's rate of decline.
All in, the only potential positives, Bollinger mid-point rising and volume declining, are not enough to get me thinking positive. More near-term downside is my thinking right now.
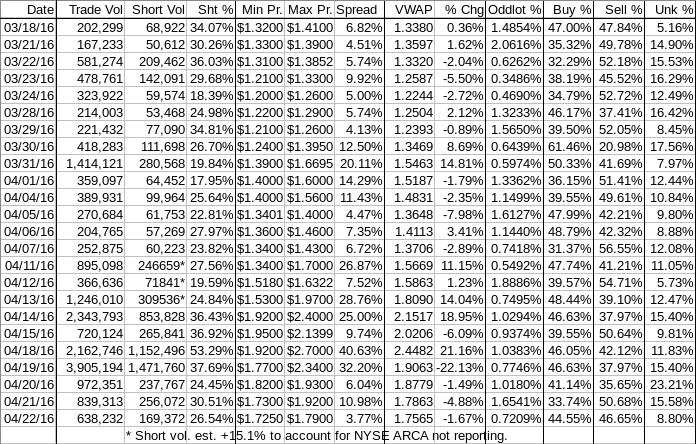
Percentages for daily short sales and buys moved in opposite directions, not good. Further, short percentage moved further below my desired range (needs re-check), likely due to a large percentage of inter/intra-broker trades from the larger trades (see above). The buy percentage improved enough that I suspect the rate of price decline may finally start to slow again, but we'll have to wait and see.
The spread narrowed significantly and is no in a "normal" range I think. This adds a little weight to the thought that the rate of decline may be slowing.
VWAP movement also does this.
All in, when I factor in volume declining but still too high, I can't get positive but I can start to see a light at the end of the tunnel and just hope it's not an on-coming freight train.
As always, much is experimental and should be treated as such.
Bill
Join the InvestorsHub Community
Register for free to join our community of investors and share your ideas. You will also get access to streaming quotes, interactive charts, trades, portfolio, live options flow and more tools.

