


Friday, April 22, 2016 9:05:20 PM
A predominate creep lower almost the whole day.
Generally, open low, go high, drop lower through ~9:53, and come back up to just above $2.00 to go flattish with the low there and the highs going $2.04, $2.03, ... $2.01 through 11:47. 11:48 did a high-volume drop to $1.99 and next a low-volume drop to $1.98 and we went low-volume flattish with lows there and highs $1.99 through 13:23. Then we got a step up to $2.01/3 and did low/no-volume flattish there until 14:25 dropped range again to $1.99/$2.01 and went flattish there, with high dropping to $2.00 mostly at 15:07, through 15:47. 15:48 did ~67.2K $2.00/5 and was followed by very low volume $2.00/4 to close the day with a 3,648 sell for $2.01.
There were seven pre-market sells totaling 1.5K $2.00-$2.08.
09:30-09:56 opened the day with a sell of 22,809 for $2.11 and traded another 5,294 that made the spread $2.10/11. 9:31-:32's ~4.3K pushed price to $2.13/4, 9:33-:35's ~84.4K stepped down to $2.03/5, 9:36-:45 did a very low-volume step up to $2.11, 9:46-:50's ~19.5K started a drop getting to $2.03/5, 9:51-:52's ~88.8K finished the drop doing $2.00->$1.95->$1.98, and 9:53-:56's 17.4K stepped up to end the period at $2.01/3.
09:57-11:15 began a low-volume $1.99/$2.03 with rising lows through 10:21, moved to $2.02/4 through 10:29, and did a long very low/no-volume flattish $2.01/3 through 11:15 to end the period at $2.01/2.
11:16-11:47 did a step down to $2.00/2 on low volume, went to $2.00/1 at 11:31, and ended the period on 11:47's 700 $2.00.
11:48-13:05 began a step down with ~27.9K $2.00->$2.01->$1.99 and went very low/no-volume $1.98/$2.00 with falling highs, to $1.98/9 by 11:53, and went very low/no-volume there to end the period on 13:05's 100 $1.99.
13:06-14:17, after a no-trades minute, began a rise with first a very low/no-volume $1.99/$2.00 through 13:24, did a step up on 13:25-:27's ~4K to $2.03, did a variable volume (mostly no/low) flattish $2.01/3 and ended the period on 14:17's ~1.4K $2.01.
14:18-15:47, after a no-trades two minutes, began very low/no-volume $1.99/$2.01 and ended the period on 15:47's 800 $1.99.
15:48-16:00 did ~67.2K $2.00->$2.05->$2.00. The rest of the day went mostly low-volume $2.00 (mostly $2.01 low though) to $2.04 and ended the period and day with a 3,648 sell for $2.01.
There were no AH trades.
Including the opening trade (closing didn't qualify), there were 24 larger trades (>=5K & 5 4K+) totaling 190,096, 26.40% of day's volume, with a $2.0350 VWAP. Excluding the opening trade, there were 23 larger trades totaling 167,287, 23.23% of day's volume, with a $2.0247 VWAP.
On the traditional TA front, movements were:
 Ending  Period  Period  Period Per. Trade_ Period_ % Day_ Per. End
 Period  Volume     Low    High Dollar Val. VWAP___ Volume Buy ~%
  09:56  239469 $1.9500 $2.1399 $490,170.62 $2.0469 33.25% 32.92% Incl 09:30 $2.1100 22,809
  11:15   78283 $1.9900 $2.0400 $158,122.83 $2.0199 10.87% 39.36% Incl 09:33 $2.1000 4,900 5,000 5,000
                                                                       09:35 $2.0500 4,800 5,000 7,500
                                                                       09:51 $2.0100 6,299 4,866
                                                                       09:52 $2.0000 18,300
  11:47   54120 $2.0000 $2.0200 $108,575.99 $2.0062  7.52% 39.12% Incl 10:59 $2.0001 4,700 11:14 $2.0299 7,000
                                                                       11:24 $2.0100 4,329
  13:05  118384 $1.9800 $2.0100 $235,324.04 $1.9878 16.44% 36.65% Incl 11:48 $2.0000 5,000 8,500
                                                                       11:59 $1.9800 10,000 12:42 $1.9899 5,000
                                                                       12:44 $1.9879 5,000
  14:17   66459 $1.9900 $2.0300 $133,518.68 $2.0090  9.23% 34.97% Incl 13:10 $1.9901 6,500
  15:47   75951 $1.9900 $2.0100 $151,627.31 $1.9964 10.55% 36.45% Incl 15:29 $1.9900 5,100 15:39 $1.9950 5,000
  16:00   80770 $1.9950 $2.0500 $164,253.95 $2.0336 11.22% 39.35% Incl 15:48 $2.0500 9,500 19,380 $2.0400 10,613
On my minimal chart the most notable thing is the big volume drop on a down day. This suggests that there's not a lot of strength (yet?) in the move lower.In fact, our low today got almost exactly to a "reversion to the mean" point ( (5/14 high minus 4/13 low of $1.53) divided by 3 and added to that low). Our high also exceeded the 13-period upper Bollinger limit, which we had been "pushing", by less so I think this is a normal "pause" caused by momo folks taking some very short-term but substantial profits.__Open_ ___Low_ __High_ _Close_ Volume_
Today -0.47% 1.56% -10.84% -3.83% -69.28%
Prior 38.56% 25.49% 21.83% 10.58% 88.10%
Yesterday I also noted { I also have concern about the timing and duration of this rise which is ostensibly based on a 4/11 1.2MW Order Libyan Oil Field Project. Usually the pops on this sort of thing starts right away and then lasts about three days before things either start returning to normal or takes a breather (small re-trace and/or consolidation) and gives us the start of a new pattern development. The one-day loss of volume and price on 4/12 and then today's huge volume/price increase are abnormal I think. }
So today fits that scenario in that yesterday was abnormal. Today gets us back to "normal" and, I think, sets us up for either a short consolidation or a resumption of the move up as the near-term profit-takers leave the space to the ones that are shooting for more.
Based only on this chart and hose considerations my bias would be low downside risk and even some upside risk tomorrow.
On my one-year chart, after yesterday's little pop up, I thought it might be time to see if I could get a more useful trend line. Sure enough, moving the origin to the high of 6/26/2015 when our longer-term move started in earnest, gave me more more touch points (four) and lots of near misses. The significant touch is top of yesterday when our high exactly touches the new line. If I had thought of that before yesterday's post I would've mentioned that it and noted it suggested at least a small re-trace today.
Well, at least I had 20-20 hindsight.

Anyway, all the SMAs continue to rise, as they should since this re-trace was so small.
The oscillators I watch, which were mixed yesterday and had overbought conditions exist on RSI and MFI, were telling the truth. Rotating from all improved the prior day to mixed with two in overbought must have triggered some of the momo traders "risky, sell" buttons.
Today they all weakened but for momentum (improved, but only marginally, again) and only RSI is still overbought. It's not a strong indicator but having only RSI overbought leaves some possibility that we could start the rise again. Like I said though, not a strong indicator. But with SMAs still rising it seems a good likelihood. That would be because the MACD is still showing strong bullish tendencies.
The 13-period Bollinger limits, $1.0862 and $2.0676 ($1.0661 and $1.9693 yesterday), are still raising the mid-point due to the more rapid rise of the upper limit vs. the rate of fall of the lower limit. Being well above both the mid-point and upper limit yesterday, today's price range drop put the range middle right on the upper Bolinger limit. This would suggest more drop to get closer to the rising mid-point.
All in, there's too many positive indications to let the Bollinger suggestion carry too much weight. I'm cautiously suggesting we could rise again tomorrow, although there is some concern that we might not do so - could go flat easily or even drop. Less chance of that latter possibility I think.
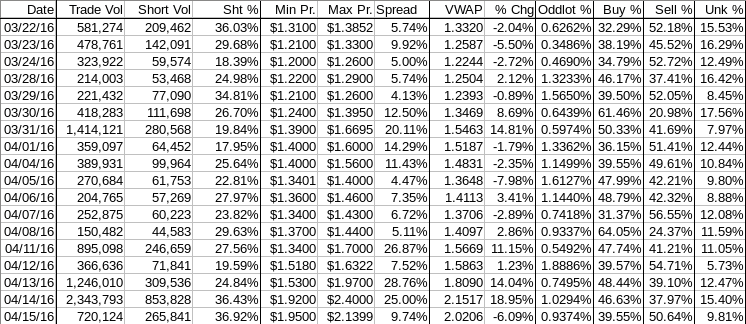
Percentages for daily short sales and buys moved ... well short percentage increased only marginally - call it flat - and buy percentage fell, as would be expected with our range contracting and moving lower. The short percentage remains only a small amount below what I (used to) consider normal. The cessation of Nyse ARCA short data makes this very iffy for now. Not much I can take from this since there's no new trend of consistent low or falling buy percentages yet.
The spread was wide but considering today's intra-day was predominately down it wasn't as wide as I would have expected prior to the start of this pop. It's wide enough to be of concern but since we're not in a defined down trend I can't say it suggests more weakness near-term.
VWAP movement wasn't bad considering how much we rose the last few days. I can't read it as a big negative considering the circumstances. Likely just a result of some early profit-taking by a portion of the momo traders?
All in, I can't draw big negatives here, especially considering the reduction in the volume.
As always, much is experimental and should be treated as such.
Bill
Join the InvestorsHub Community
Register for free to join our community of investors and share your ideas. You will also get access to streaming quotes, interactive charts, trades, portfolio, live options flow and more tools.

