


Saturday, August 29, 2015 3:52:09 PM
A nice atypical day with some nice volume on a nice up-day! It was busy and so my minute-by-minute equivalent is a bit larger than normal.
We opened with a smallish block, 15,105, at $0.38 and immediately started climbing on rising volume, peaking at 126,065 shares at 9:43 that hit a high of $0.39. Then 9:44-10:05 was a very low-volume series of erratic steps lower, bottoming at $0.3792 at 10:02 and rising slightly through the period end on very little volume. 10:06-10:20 had an inverted version of that, also low volume, that rose to $0.3874. 10:21-10:28 began with a gap up to $0.3899, went pretty much flat at $0.39 until 10:26, when a dip to $0.3891 on ~31K occurred. Another short flat at $0.39 and high volume was followed by another one-minute volatile $$0.3886-$0.3916 range. 10:29-10:56 was absolutely flat at $0.3899-$0.3901, mostly low volume but having good volume at 10:36-10:37, aggregating ~37.5K. 10:57-11:02 began with a dip to $0.3885 on ~15K, had a low-volume flat period for a couple minutes and then traded $0.3893-$0.3923 on 32.1K shares at 10:59 and went flat again at $0.39 on low volume. 11:03-11:29 was absolutely flat but for 11:03's frenzied moment when 47.8K had a big drop and rose back up in the next minute. 11:30-11:34 was a low-volume small dip. 11:35-12:04 was a series of good-volume steps up that achieved $0.42 at 12:02 and held there the next couple of minutes. 12:05-12:56 (last trade 12:54) was a flattish low-volume, mostly, period interspersed with sudden one-minute spikes down on large one-minute volumes, mostly. In each case it recovered back up to trade in the range of $0.418x, mostly. 12:57-13:50 (last trade 13:49) was a low-volume sag to $0.4059 by 13:04 followed by a long low-volume flattish period in the range of $0.4061-$0.41. 13:51-14:02 began with a few minutes of low-volume push up to $0.4163 at 13:54, where it hung out at for two minutes on almost no volume and then began vacillating between $0.4163 and a rising low from $0.4131 to eventually hit $0.4163. That led to 14:03-14:30 taking a drop to $0.4102 on ~31K through 14:04 followed by flat low-volume range of $0.4102-$0.415. 14:31-14:54 took a dive to $0.4063 on 52.3K in the first three minutes and then went sideways in a low-volume tight $0.4063-$0.4093 range. 14:55-15:19 started with a 500 share drop to $0.4025 and an immediate reversal to begin a push up to $0.415 by 15:00 with the two-minutes totaling 42K, much higher volume than the rest of the period. That was followed by a flat top at ~$0.415 with rising lows from $0.4101 to $0.415 at the end. 15:20-15:53 took a two-minute 25K pop up to $0.418 and went flat in a $0.4150-$0.418 range. 15:54-16:00 started with a low-volume drop to $0.4111 followed by putzing around between there and $0.415 and then $0.4128 in the last two minutes and we closed with a smallish block at $0.4111.
We had an AH trade of 1K shares at $0.4182.
Lots of larger (>=20K + one 19.8K) trades today. Including the closing block, there were 17 totaling 502,073 shares, 21.21% of day's volume, with a VWAP of $0.4063. Excluding the closing block there were 16 totaling 481,700 shares, 20.35% of day's volume, with a VWAP of $0.4061.
It's interesting how the price on them just kept going higher, unlike the usual behavior where we see larger "behind the curtain" trades go off below then-current market price most of the time. It's almost like they wanted to gobble up all the low-hanging offers to move the market up, which did occur. Trying to be open to other than TFH-inspired reasoning, I guess it's possible that they just saw so much under-valuation that they felt any price in this area was an outstanding value. Yeah, right! It's more likely that momo traders were piling in than that. 'Course I think the TFH assessment is most likely correct.
Notice in the second table below what really, really nice buy percentages we saw, apparently engendered by these block trades.
If every day was like this trades would go to zero as we would know the next day would be higher so why sell today?09:43:32 $0.3840 25,000
09:43:34 $0.3900 25,000
09:43:39 $0.3900 25,000
10:28:07 $0.3886 35,000
11:51:43 $0.4050 25,000
11:54:46 $0.4023 20,000
12:06:54 $0.4190 27,600
12:07:07 $0.4179 27,000
12:30:33 $0.4125 21,000
12:33:38 $0.4126 19,800
13:25:32 $0.4062 45,000
13:59:31 $0.4163 32,000
14:12:52 $0.4102 42,000
14:59:01 $0.4059 21,400
15:05:43 $0.4101 39,200
15:15:14 $0.4150 51,700
16:00:00 $0.4111 20,373
On the traditional TA front ... YOWZAH! We had a higher open, low, high and close, up 10.78%, on volume up 253.03%! It's so much fun I thought a lower right portion of my newest minimal chart might be appropriate.Ending Period Period- Period- Per. Trade_ Period_ % Day_ Period
Period Volume --Low-- --High- Dollar Val. VWAP___ Volume Buy ~%
09:43 255141 $0.3720 $0.3900 $97,850.79 $0.3835 10.78% 93.94% Incl. 09:30 $0.3800 15,105 09:43 25K ea: $0.3840 $0.3900 $0.3900
10:05 45655 $0.3792 $0.3900 $17,697.94 $0.3876 1.93% 89.53%
10:20 34850 $0.3792 $0.3874 $13,458.37 $0.3862 1.47% 89.67%
10:28 129055 $0.3886 $0.3916 $50,281.58 $0.3896 5.45% 90.20% Incl. 10:28 $0.3886 35,000
10:56 108987 $0.3899 $0.3901 $42,502.73 $0.3900 4.60% 74.82%
11:02 61600 $0.3885 $0.3923 $24,014.64 $0.3898 2.60% 73.44%
11:29 150254 $0.3710 $0.3900 $58,234.53 $0.3876 6.35% 72.22%
11:34 40500 $0.3869 $0.3900 $15,753.13 $0.3890 1.71% 73.43%
12:04 339739 $0.3900 $0.4200 $138,164.97 $0.4067 14.35% 74.15% Incl. 11:51 $0.4050 25,000 11:54 $0.4023 20,000
12:54 332155 $0.4033 $0.4200 $138,509.64 $0.4170 14.03% 66.27% Incl. 12:06 $0.4190 27,600 12:07 $0.4179 27,000
12:30 $0.4125 21,000 12:33 $0.4126 19,800
13:49 126285 $0.4059 $0.4169 $51,676.04 $0.4092 5.34% 61.98% Incl. 13:25 $0.4062 45,000
14:02 109892 $0.4099 $0.4163 $45,588.07 $0.4148 4.64% 62.67% Incl. 13:59 $0.4163 32,000
14:30 93146 $0.4102 $0.4157 $38,362.19 $0.4119 3.94% 60.80% Incl. 14:12 $0.4102 42,000
14:54 72330 $0.4061 $0.4115 $29,603.31 $0.4093 3.06% 58.95%
15:19 238656 $0.4025 $0.4150 $98,221.29 $0.4116 10.08% 58.35% Incl. 14:59 $0.4059 21,400 15:05 $0.4101 39,200
15:15 $0.4150 51,700
15:53 170070 $0.4137 $0.4180 $70,883.89 $0.4168 7.18% 58.34%
16:00 54492 $0.4110 $0.4161 $22,468.55 $0.4123 2.30% 57.76% Incl. 16:00 $0.4111 20,373
16:20 1000 $0.4182 $0.4182 $418.20 $0.4182 0.04% 57.78%

Notice how we moved smartly up and out of the decending trading channel (descending red and green lines), busted right through a potential descending resistance from a consolidation triangle yet to be confirmed (white lines: BTW we spent a fair amount of time right on that resistance line today) and moved right to, and quickly through, our old friend of $0.41 (which I forgot to label $0.41/2 yesterday) and stopped right where all the traditional TA charts suggest we should (the two horizontal yellow lines are $0.41 and $0.42).
Isn't it amazing?!
Anyway, the oscillators I watch went from mixed to all going positive, a natural effect of higher VWAP (see below) and volume up ~253%. All but MFI (untrusted by me) are at (full stochastic) or above neutral. ADX-related made a positive cross but it will take a bit to go decidedly positive from the low level it was at. Williams %R should enter overbought tomorrow.
The mid-point of the trading range today is about at the mid-point of the 13-period Bollinger band and we closed above my one-year chart's long-term descending resistance, which is at $0.405 as nearly as I can tell. One more day's close above confirms a break out.
Another potential descending resistance, unconfirmed as it has only the origin and one touch thus far, is at ~$0.488 AFAICT today. So I would call the next long target to be ~$0.48/9, with a potential pause around $0.44, but if this volume and large block trading continues I would expect us to blow right by it.
We also moved right by the 50-day SMA, ~$0.3830 today, and the 10 and 20-day SMAs should also cross above the 50 in a day or two if this behavior continues. I also expect we'll start "pushing" the upper Bollinger limit if this continues.
Yesterday I said { Overall, I think the traditional TA is telling a more positive story now. But knowing that 85% of shares are held by retail we need to wait and see how the results of the voting, specifically the RS outcome, and tone of the AGM were received by them. } With my TFH firmly in place, I don't think we saw evidence of any retail investor sentiment today. Instead, read beginning with the "entertainment value" part of my my reply to lloyd20 to see what sort of thing I suspect.
Regardless, my TFH tells me that we are now embarking on a long upward journey, supported by the traditional TA which everybody who can move this market understands. And I can't (yet?) use traditional TA to refute my TFH, so "their plan" is working.
However, I do have other tools, which may or may not lead to valid conclusions - they are experimental.
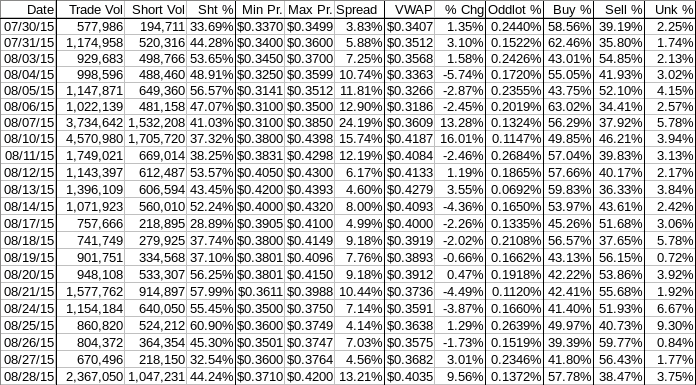
Note that percentages moved in the same direction, a good thing, but the daily short percentage is not as high as I expected.
This is easily explained by the fact that I was unaware of the volume in larger block trades we would end with because at the time I posted I had not run the daily transactions through my process yet. Larger trades, many of which are often "block" trades that go off "behind the curtain" as inter/intra-broker trades in one of the many periods NASDAQ provides throughout the day for these, do not result in short sales. The are ostensibly supported so larger trades by such as institutions and mutual funds can avoid high fees and/or unduly influencing the market, to the detriment of those making the block trades of course, by exposing these large bid/ask quantities to us peons.
With 20%+ of today's volume being in these larger block trades, it's reasonable to at least consider the effect of removing them since they generally do not result in short sales anyway. This is always somewhat dangerous in that it could lead to wrong conclusions via the altered data, but it's still worth considering.
Reducing the volume by all but the closing block, we would have daily volume of 1,885,350, up 181.19% instead of 253%. Of course removing all is unreasonable in that even on low-volume days we commonly have one or two larger blocks. But since we are guessing anyway, I won't try to slice things too thin here. With that ~1.89MM trade volume the short percentage would become 55.55%, much closer to my expectations and showing movement more in line with the buy percentage movement.
That leads to an assessment of a "normal" market today with only the short percentage so far above my desired range (needs re-check) being of concern. That is allayed by the fact that we had a big volume spike, even sans the larger blocks, combined with a substantial price appreciation. One could reasonably guess that many retail folks who had been battered so often by this stock made snap-decisions to take profit (or cut losses) when they saw intra-day highs moving around that $0.41 area. It's likely that a high percentage of these shares were not inter/intra-broker trades and went through an MM, which more often results in a short sale.
For that reason I don't consider that elevated reading, after futzing with the data of course, to be a negative. And before futzing with it we are right at the top side of my desired range.
The price spread would be a concern if we were in a down trend but we left that situation four days ago and began a sideways move. Combined with two days pushing price higher I would normally not be concerned. I do have concerns, addressed sufficiently in other places (and linked) above. But those concerns are not artifacts of this data. They could be artifacts of the timing of things (including the Prospectus and 8-K released late Friday) and the large increase in trade volume and larger block volume and the (guessed at) presence of such as Cowan & Co. who make money only if they can sell shares for Capstone.
So all in, I don't see anything here that makes me think any kind of big move back down is likely for now. I do see small items that suggest more upside, most specifically the recent change in trend of VWAP, buy percentage and daily short percentage, which earlier had shown signs of trying to break out of the weakening trend.
I had been calling for a move towards the descending resistance and was beginning to have doubts.
As always, much is experimental and should be treated as such.
Bill
Join the InvestorsHub Community
Register for free to join our community of investors and share your ideas. You will also get access to streaming quotes, interactive charts, trades, portfolio, live options flow and more tools.

