


Monday, June 29, 2015 4:27:09 PM
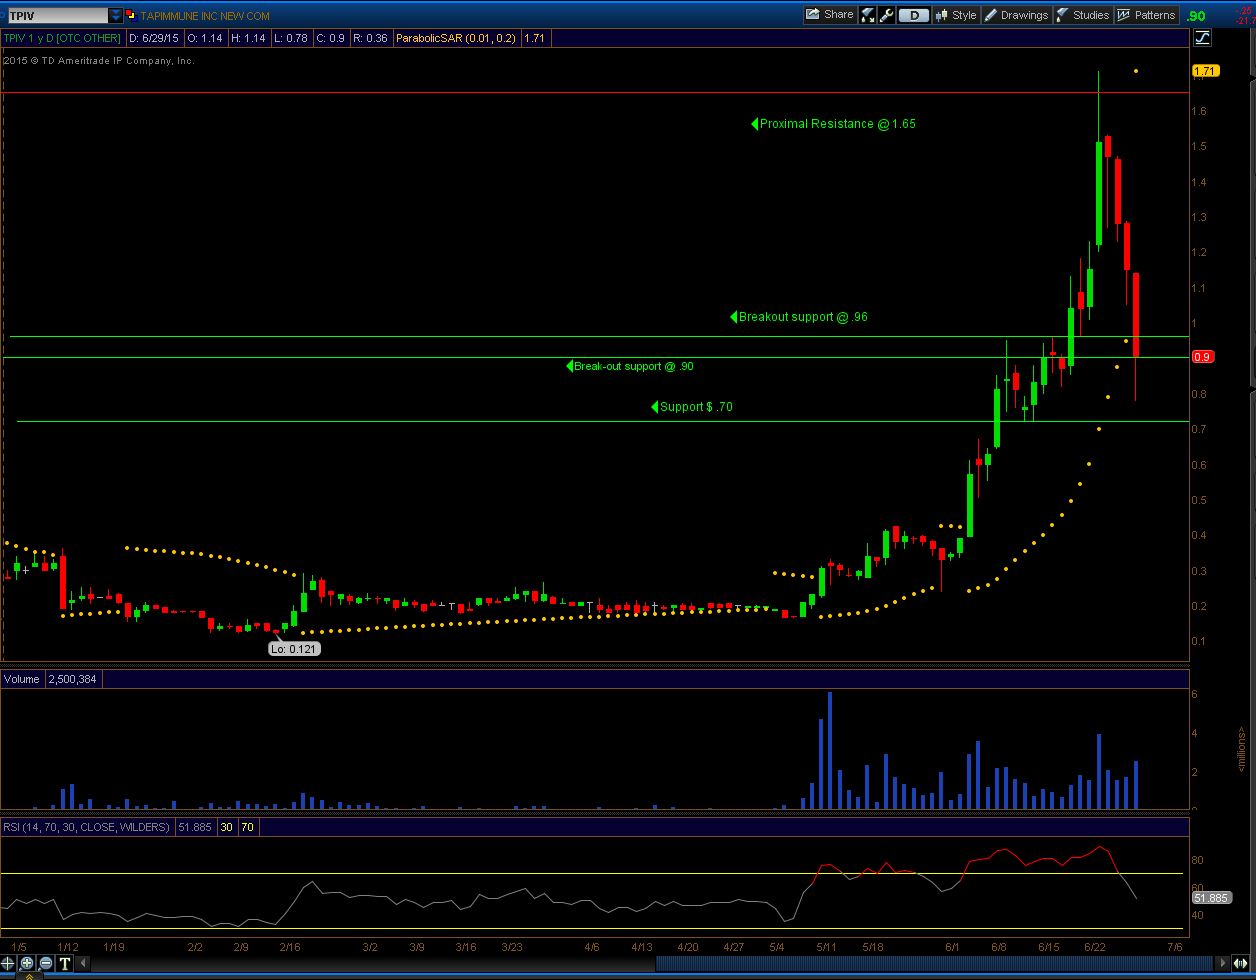
This is a fairly common chart for price action. The news rally took TPIV to test resistance at 1.65. It closed below this line, consolidated the next day after testing most of the range of the good news day.
A three day decline brought TPIV back to test the two break-out levels. Not the strongest price action in a bullish chart (obviously), but a common one.
We see the wick break-out level of .96 was tested and exceeded. Interestingly the closing price break-out level of .90 was tested, and TPIV closed right at this price. Often closing prices are more meaningful, such as in this case.
The low of the consolidation range from the last rally leg is at .70, and was nearly tested.
Chart perspective, remains in bullish rally mode. While the last rally leg has retraced almost 100%, it is not a failed rally until several closes back in the prior consolidation range.
I find the chart more descriptive of past action than predictive. I know many consider them predictive of future action. In my view, almost anything could have happened, but what we see is what actually happened.
(TPIV Daily, click to enlarge)

The stock market is simply the transfer of wealth from the impatient to the patient. - Warren Buffet
Recent MRKR News
- Principal Investigator from City of Hope National Medical Center Invited to Present Clinical Data from Marker Therapeutics APOLLO Study at 11th Global Summit on Hematologic Malignancies • GlobeNewswire Inc. • 04/08/2024 11:00:39 AM
- Marker Therapeutics Reports Year-End 2023 Corporate and Financial Results • GlobeNewswire Inc. • 03/25/2024 09:45:00 PM
- Marker Therapeutics to Present at the H.C. Wainwright 2nd Annual Cell Therapy Virtual Conference • GlobeNewswire Inc. • 03/22/2024 04:30:51 PM
- Form 8-K - Current report • Edgar (US Regulatory) • 03/01/2024 01:02:47 PM
- Form 8-K - Current report • Edgar (US Regulatory) • 02/26/2024 12:58:51 PM
- Marker Therapeutics Receives Approval from United States Adopted Name (USAN) Council and International Nonproprietary Names (INN) Expert Committee for “Neldaleucel” as Nonproprietary Name for MT-601 • GlobeNewswire Inc. • 01/22/2024 12:30:00 PM
- Form 8-K - Current report • Edgar (US Regulatory) • 01/08/2024 01:30:48 PM
- Marker Therapeutics Announces Clinical Program Updates and Pipeline Prioritization • GlobeNewswire Inc. • 01/08/2024 01:24:49 PM
- Marker Therapeutics Announces Participation in Biotech Showcase and the 19th Annual Non-Dilutive Funding Summit During “J.P. Morgan Week 2024” • GlobeNewswire Inc. • 12/21/2023 04:00:00 PM
- Form 8-K - Current report • Edgar (US Regulatory) • 12/11/2023 12:35:22 PM
- Marker Therapeutics Announces Sustained Complete Response in First Lymphoma Patient Treated with MT-601 following CAR T Relapse • GlobeNewswire Inc. • 12/11/2023 12:00:00 PM
- Form 8-K - Current report • Edgar (US Regulatory) • 11/20/2023 09:37:41 PM
- Form 8-K - Current report • Edgar (US Regulatory) • 11/09/2023 10:03:53 PM
- Marker Therapeutics Reports Third Quarter 2023 Financial Results and Provides Business Updates • GlobeNewswire Inc. • 11/09/2023 10:00:00 PM
- Form 10-Q - Quarterly report [Sections 13 or 15(d)] • Edgar (US Regulatory) • 11/09/2023 09:31:53 PM
- Form 8-K - Current report • Edgar (US Regulatory) • 09/11/2023 11:10:46 AM
- Marker Therapeutics Announces Complete Response in First Lymphoma Patient Treated with MT-601 after CAR T Relapse • GlobeNewswire Inc. • 09/11/2023 11:00:00 AM
- Marker Therapeutics to Present at the H.C. Wainwright 25th Annual Global Investment Conference • GlobeNewswire Inc. • 08/30/2023 12:00:38 PM
- Form 8-K - Current report • Edgar (US Regulatory) • 08/14/2023 08:37:04 PM
- Marker Therapeutics Reports Second Quarter 2023 Financial Results and Provides Business Update • GlobeNewswire Inc. • 08/14/2023 08:30:27 PM
- Form 10-Q - Quarterly report [Sections 13 or 15(d)] • Edgar (US Regulatory) • 08/14/2023 08:03:55 PM
- Form 8-K - Current report • Edgar (US Regulatory) • 08/07/2023 11:22:44 AM
- Marker Therapeutics Reports Non-Clinical Proof-of-Concept Data and Update on Clinical Readiness for the MT-401 Off-the-Shelf Program • GlobeNewswire Inc. • 08/07/2023 11:00:17 AM
- Marker Therapeutics to Participate in Virtual Roundtable with Key Opinion Leaders to Discuss Clinical Landscape of CAR-T Cell Therapies on August 9, 2023 • GlobeNewswire Inc. • 07/26/2023 11:00:00 AM
- Form 8-K - Current report • Edgar (US Regulatory) • 07/10/2023 11:09:50 AM
FEATURED Cannabix's Breath Logix Alcohol Device Delivers Positive Impact to Private Monitoring Agency in Montana, USA • Apr 25, 2024 8:52 AM
Kona Gold Beverages, Inc. Announces Name Change to NuVibe, Inc. and Initiation of Ticker Symbol Application Process • KGKG • Apr 25, 2024 8:30 AM
Axis Technologies Group and Carbonis Forge Ahead with New Digital Carbon Credit Technology • AXTG • Apr 24, 2024 3:00 AM
North Bay Resources Announces Successful Equipment Test at Bishop Gold Mill, Inyo County, California • NBRI • Apr 23, 2024 9:41 AM
Epazz, Inc.: CryObo, Inc. solar Bitcoin operations will issue tokens • EPAZ • Apr 23, 2024 9:20 AM
Avant Technologies Launches Advanced AI Supercomputing Network and Expansive Data Solutions • AVAI • Apr 23, 2024 8:00 AM

