


| Followers | 559 |
| Posts | 23793 |
| Boards Moderated | 0 |
| Alias Born | 03/06/2009 |
Saturday, November 22, 2014 12:36:45 PM
Good read matt! Some more "Gold/Silver & Junior Gold Miners Analysis and Predictions" worth reading...
Was Gold's Dip to $1,130 the Bottom?
Jason Hamlin
November 21, 2014
Gold made an all-time nominal high of $1,923 in September of 2011. In the following three years until the present, it has been mostly downhill. This is the longest and deepest correction of the entire bull market that started in 2001. The gold price has declined by a whopping 41% over the past three years and investors have differing opinions about what comes next.
Gold bears point to the fact that the triple bottom on the technical chart failed in early November. Many believe gold will ultimately bottom around $1,000, with some forecasting a dip below $700. There were multiple days of gold closing below the important technical support level of $1,180, giving further credence to the downside projections. However, gold has since bounced back above this key support level.
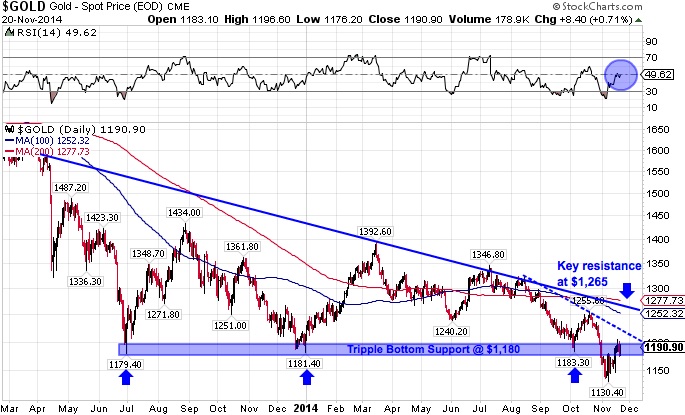
Investors should watch closely to see if $1,180 can hold the second time around, after failing in early November. Gold needs to move above the short-term downward sloping trend line (dotted) that is charted above. This would be a bullish reversal and increase our confidence that the bottom is in. The next major resistance is around $1,265, which corresponds with the long-term trend line and is directly between the 100-day and 200-day moving averages. Such a move back above $1,265 would turn our sentiment back to being strongly bullish.
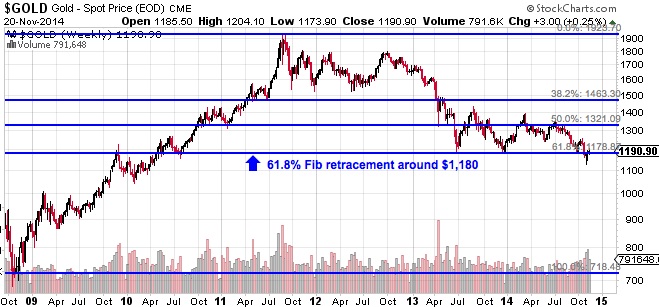
Further highlighting the importance of the $1,180 price level, the chart below shows this price is also the 61.8% Fibonacci retracement level. Gold has now retraced 61.8% of the advance it made from $700 in late 2008 to $1,923 in 2011. This is the final Fibonacci support level and failure of this support greatly increases the chances of a dip below $1,000. Of course, the Fibonacci analysis suggests that the move is corrective in nature and not the start of a new bear trend in gold.
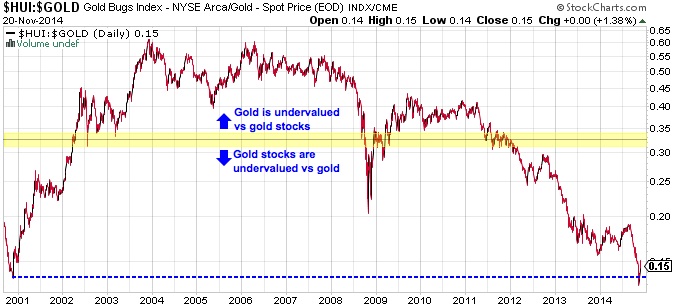
Fundamentally, it is hard to imagine that we are in a new multi-year bear market. Prices are now below the all-in production cost for many miners and we believe that such conditions cannot persist for too long. Therefore, the current move is most likely a correction within a longer-term bull market.
We believe in holding physical metals in your possession first and foremost. But it has hard to ignore the value being offered in mining stocks at the moment. In fact, mining equities are the most undervalued (relative to gold) that they have been since the very start of the bull market in 2001.
If gold doubles towards its inflation-adjusted high of $2,400 in the coming years, quality mining stocks could easily climb by 400 to 500%. This move may already be underway, as many of the mining stocks that we track are up 50% or more in November alone. The Gold Miners ETF (GDX) is up more than 21% in the past two weeks since bottoming on November 5th.
It is bullish to see mining equities lead the metals higher and to see silver lead gold higher. With both of these factors confirmed, we added to our positions during the first week of November. But I still have plenty of powder dry, as significant downside risk remains until gold bounces back above $1,265.
Making short-term price predictions in this market is a fool's errand. I have no idea where the price will be next week or even next month. But it seems to me that the upside potential in the precious metals market dwarfs the downside risk at this juncture. I think $1,130 gold and $16.59 GDX was likely the bottom. I plan to keep buying the dips with the view that prices will likely be much higher over the next 12-24 months.
Greenspan’s Gold Forecast Concurs With Chart Analysis
Mary Anne & Pamela Aden
November 20, 2014
Insights
The highlight for the always great New Orleans investment conference last month was Allan Greenspan. He was special.
One key moment was when he was asked about gold. He said gold is a good place to put your money these days as its value as a currency sits outside of government policies.
When asked where it will be in 5 years, he said “higher.” By how much, he replied “measurably.”
Gold: Focus on big picture
We have to say that gold on a big picture basis is saying the same thing Allen Greenspan is suggesting. And it shows why central banks are buying physical gold and wanting to keep it in their home country.
Eventually gold is going higher. And if you ask, what will gold be doing two years from now? We’d say, it’s more likely to be on an upward path.
The following chart shows gold has phases, and impressively they continue to work. This reinforces that gold is a cyclical market.
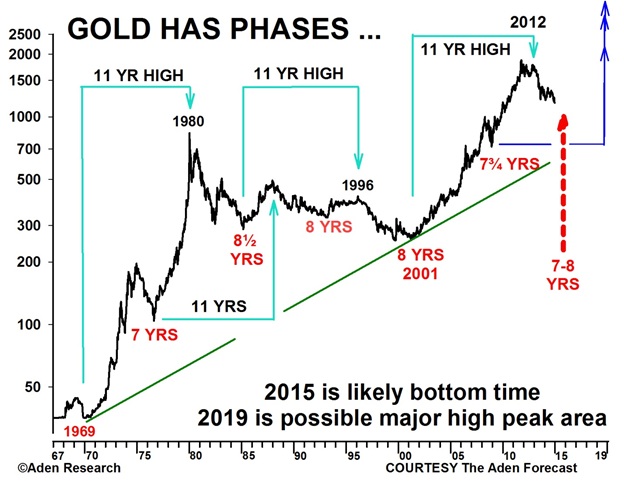
Note on the chart that gold has formed a bottom area every 7-8 years since 1969. It’s also formed a major high area every 11 years since then.
The 7-8 year low areas are in red. Nov 2008 was the last low time at the 7¾ year mark, which was the 5th time since 1969. We’ll now see if this time period going forward identifies the next low for gold.
If so, the next likely time could be as early as this month of November. But taking the more likely average, it could be next Summer and up to November 2015. On the unusually long side, it could happen during the first quarter 2016.
The point is, the cyclically low time period is getting closer.
More exciting is what happens next. Once the low is clearly established, gold will have a green light to rise in a strong bull market.
This means 2019 will be the next likely time for a major peak. It will be the 11 year mark from the 2008 lows, for the 4th time in 45 years.
This tells us that despite current volatility, with today’s world in an unprecedented condition, we’ll likely see gold at super new record highs in the years ahead.
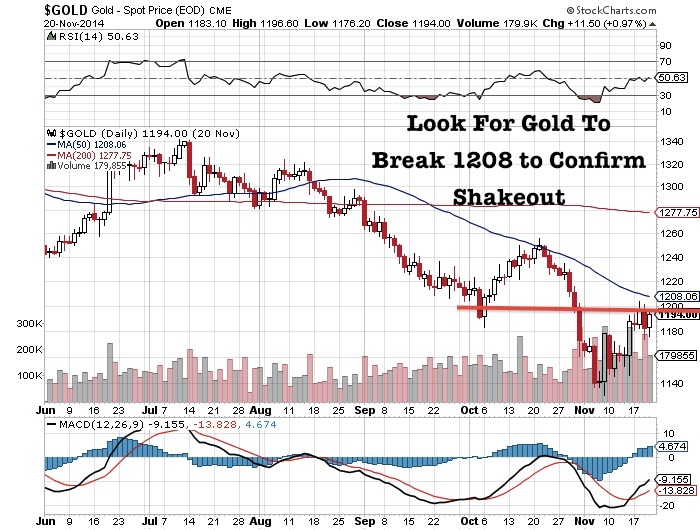
Junior Gold Miners (GDXJ) Breaking Three Month Downtrend?
Jeb Handwerger
November 21, 2014
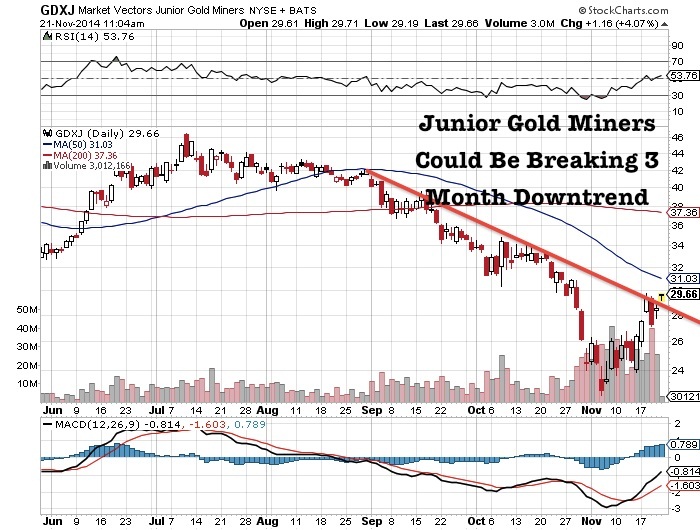
The junior gold miners (GDXJ) appear to be on the verge of breaking a three month downtrend. There have been some strong days of accumulation in November. A break above the 50 day moving average at $31 would confirm the painful correction is over.
Gold broke below $1180 which triggered a lot of stop losses and margin calls. The weak hands were shaken out and it appears there was large accumulation as volume was high. Now gold appears to be reversing higher breaking above the critical $1200 mark. Look for gold to break above the 50 day at $1208 to confirm a potential shakeout.
For about the two past months, we have witnessed panic selling in precious metals and junior miners the capitulation. However, on November 7th and 14th we saw major accumulation in gold futures on high volume. This may signal the beginning of a major short covering combined with value buying or the accumulation after the capitulation.

Silver has seen a nice bounce off $15 with some accumulation. Look to see if silver can break recent five month downtrend at $16.50 and hit over 50 on the RSI.
Some of our junior miners including what I believe are the top three discoveries in Nevada were affected by the panic selloff which I said may be a bargain buying opportunity. Despite making new high grade discoveries these stocks were trading for at least 50% off. Smart money continues to accumulate while the weak hands panic.
How does one find the mining stocks that outperform? One of the best ways is follow the majors with top technical teams. Look to see what they are investing in and try to buy it at a discount to what they payed for it. If you see a NYSE producer taking equity positions in a small cap junior than that may be a takeout target in the next upswing.
Was Gold's Dip to $1,130 the Bottom?
Jason Hamlin
November 21, 2014
Gold made an all-time nominal high of $1,923 in September of 2011. In the following three years until the present, it has been mostly downhill. This is the longest and deepest correction of the entire bull market that started in 2001. The gold price has declined by a whopping 41% over the past three years and investors have differing opinions about what comes next.
Gold bears point to the fact that the triple bottom on the technical chart failed in early November. Many believe gold will ultimately bottom around $1,000, with some forecasting a dip below $700. There were multiple days of gold closing below the important technical support level of $1,180, giving further credence to the downside projections. However, gold has since bounced back above this key support level.

Investors should watch closely to see if $1,180 can hold the second time around, after failing in early November. Gold needs to move above the short-term downward sloping trend line (dotted) that is charted above. This would be a bullish reversal and increase our confidence that the bottom is in. The next major resistance is around $1,265, which corresponds with the long-term trend line and is directly between the 100-day and 200-day moving averages. Such a move back above $1,265 would turn our sentiment back to being strongly bullish.
Further highlighting the importance of the $1,180 price level, the chart below shows this price is also the 61.8% Fibonacci retracement level. Gold has now retraced 61.8% of the advance it made from $700 in late 2008 to $1,923 in 2011. This is the final Fibonacci support level and failure of this support greatly increases the chances of a dip below $1,000. Of course, the Fibonacci analysis suggests that the move is corrective in nature and not the start of a new bear trend in gold.

Fundamentally, it is hard to imagine that we are in a new multi-year bear market. Prices are now below the all-in production cost for many miners and we believe that such conditions cannot persist for too long. Therefore, the current move is most likely a correction within a longer-term bull market.
We believe in holding physical metals in your possession first and foremost. But it has hard to ignore the value being offered in mining stocks at the moment. In fact, mining equities are the most undervalued (relative to gold) that they have been since the very start of the bull market in 2001.

If gold doubles towards its inflation-adjusted high of $2,400 in the coming years, quality mining stocks could easily climb by 400 to 500%. This move may already be underway, as many of the mining stocks that we track are up 50% or more in November alone. The Gold Miners ETF (GDX) is up more than 21% in the past two weeks since bottoming on November 5th.
It is bullish to see mining equities lead the metals higher and to see silver lead gold higher. With both of these factors confirmed, we added to our positions during the first week of November. But I still have plenty of powder dry, as significant downside risk remains until gold bounces back above $1,265.
Making short-term price predictions in this market is a fool's errand. I have no idea where the price will be next week or even next month. But it seems to me that the upside potential in the precious metals market dwarfs the downside risk at this juncture. I think $1,130 gold and $16.59 GDX was likely the bottom. I plan to keep buying the dips with the view that prices will likely be much higher over the next 12-24 months.
Greenspan’s Gold Forecast Concurs With Chart Analysis
Mary Anne & Pamela Aden
November 20, 2014
Insights
The highlight for the always great New Orleans investment conference last month was Allan Greenspan. He was special.
One key moment was when he was asked about gold. He said gold is a good place to put your money these days as its value as a currency sits outside of government policies.
When asked where it will be in 5 years, he said “higher.” By how much, he replied “measurably.”
Gold: Focus on big picture
We have to say that gold on a big picture basis is saying the same thing Allen Greenspan is suggesting. And it shows why central banks are buying physical gold and wanting to keep it in their home country.
Eventually gold is going higher. And if you ask, what will gold be doing two years from now? We’d say, it’s more likely to be on an upward path.
The following chart shows gold has phases, and impressively they continue to work. This reinforces that gold is a cyclical market.

Note on the chart that gold has formed a bottom area every 7-8 years since 1969. It’s also formed a major high area every 11 years since then.
The 7-8 year low areas are in red. Nov 2008 was the last low time at the 7¾ year mark, which was the 5th time since 1969. We’ll now see if this time period going forward identifies the next low for gold.
If so, the next likely time could be as early as this month of November. But taking the more likely average, it could be next Summer and up to November 2015. On the unusually long side, it could happen during the first quarter 2016.
The point is, the cyclically low time period is getting closer.
More exciting is what happens next. Once the low is clearly established, gold will have a green light to rise in a strong bull market.
This means 2019 will be the next likely time for a major peak. It will be the 11 year mark from the 2008 lows, for the 4th time in 45 years.
This tells us that despite current volatility, with today’s world in an unprecedented condition, we’ll likely see gold at super new record highs in the years ahead.
Junior Gold Miners (GDXJ) Breaking Three Month Downtrend?
Jeb Handwerger
November 21, 2014

The junior gold miners (GDXJ) appear to be on the verge of breaking a three month downtrend. There have been some strong days of accumulation in November. A break above the 50 day moving average at $31 would confirm the painful correction is over.
Gold broke below $1180 which triggered a lot of stop losses and margin calls. The weak hands were shaken out and it appears there was large accumulation as volume was high. Now gold appears to be reversing higher breaking above the critical $1200 mark. Look for gold to break above the 50 day at $1208 to confirm a potential shakeout.

For about the two past months, we have witnessed panic selling in precious metals and junior miners the capitulation. However, on November 7th and 14th we saw major accumulation in gold futures on high volume. This may signal the beginning of a major short covering combined with value buying or the accumulation after the capitulation.

Silver has seen a nice bounce off $15 with some accumulation. Look to see if silver can break recent five month downtrend at $16.50 and hit over 50 on the RSI.
Some of our junior miners including what I believe are the top three discoveries in Nevada were affected by the panic selloff which I said may be a bargain buying opportunity. Despite making new high grade discoveries these stocks were trading for at least 50% off. Smart money continues to accumulate while the weak hands panic.
How does one find the mining stocks that outperform? One of the best ways is follow the majors with top technical teams. Look to see what they are investing in and try to buy it at a discount to what they payed for it. If you see a NYSE producer taking equity positions in a small cap junior than that may be a takeout target in the next upswing.

Join the InvestorsHub Community
Register for free to join our community of investors and share your ideas. You will also get access to streaming quotes, interactive charts, trades, portfolio, live options flow and more tools.

