"Today, of course, is Halloween, which means I'm required by law to make some stupid obligatory Halloween-related market comments about bears getting tricks and bulls getting treats, or about how bulls put the "jack" in "jack-o'-lantern" or something similar -- but I'll do no such thing in this column. Come and get me, Stupid Obligatory Seasonal Comment Police!
With futures up approximately 20,000 points as of the time of this writing, if nothing else, we can't say that this market didn't foreshadow this possibility. I ended Wednesday's update with the following:
My conclusion, trade-wise at this moment, is that with a typical rally, I might think it was nearing completion -- but this rally has already clearly shown it's not a "typical" rally; therefore, we would be foolish to ignore that and attempt to treat it as we would a typical wave. We've only had one clear impulsive decline in this whole rally (last Thursday), and that did indeed point the way to an ABC decline on Friday, though it fell short of its targets. The next impulsive decline will thus be the first confirmative signal that helps point the way toward an end to the rally; until then, this rally has already shown us that most anything's possible.
Also on Wednesday, I had noted 1995-1999 as a potential target for the current wave sub-wave, with the warning that if a fourth and fifth wave were in the cards, that would not be the final high for this move. SPX did hit the 1995-99 target, and that generated a massive 12-point reversal (I initially wrote "massive" with the intent of being sarcastic, but, come to think of it: during this rally, 12 points of decline actually is a massive reversal) prior to this morning's futures ramp (yes, this is still the same sentence).
We're going to look at just two charts today, because, frankly, given the unusual nature of this rally, pretty much every wave count out there should probably be treated as speculative at best. This goes back to what I've spoken about many times before: know and respect the limitations of every system, and know your limitations as a trader.
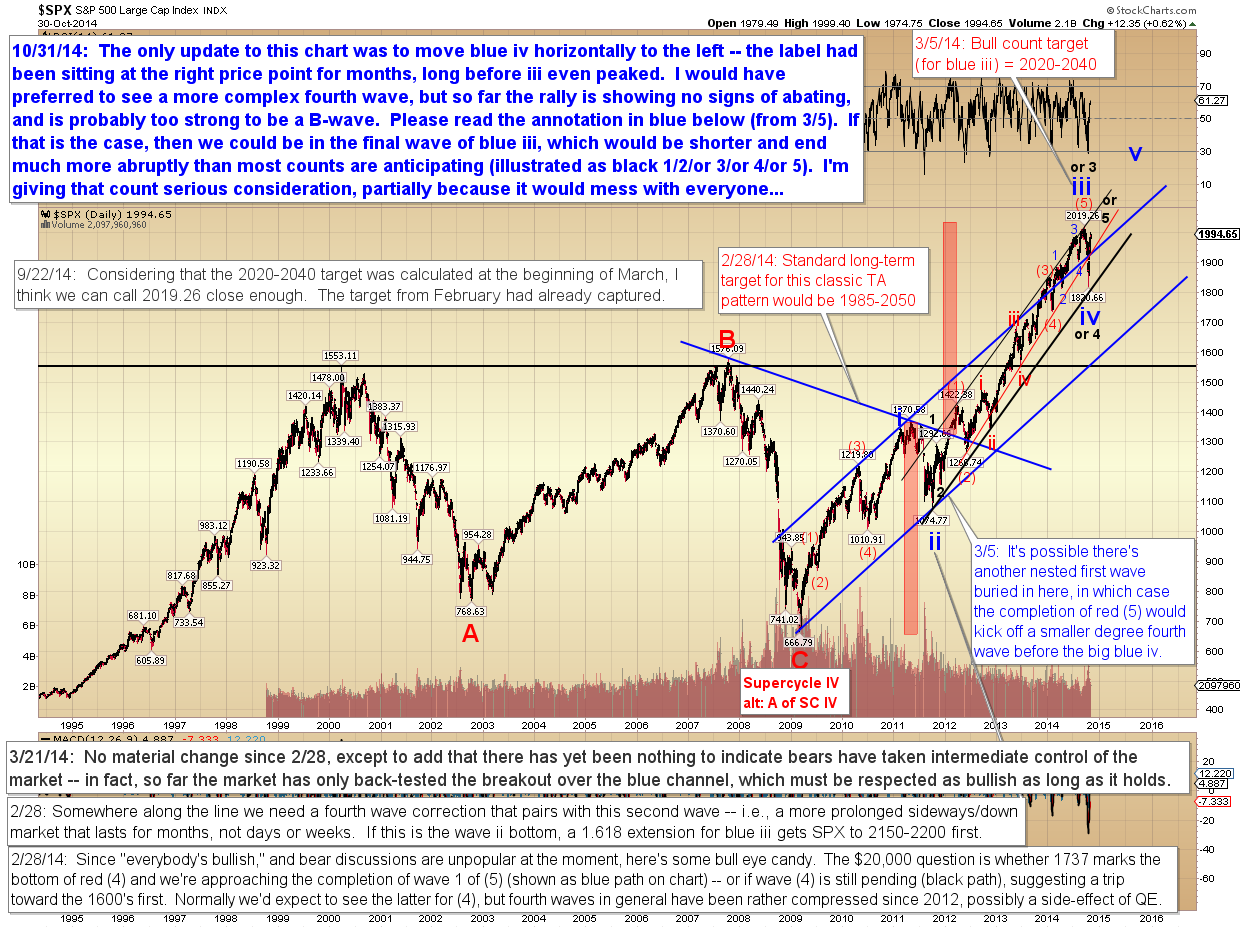
First up is the long-term chart. Wave IV seems to have completed in the expected price zone, but was a bit short in terms of time. This does allow for the technical possibility that it was a smaller degree fourth wave than most of us were expecting, which means the rally has the option to make new highs, then terminate abruptly and unexpectedly, thus catching bulls and bears alike completely off-guard. I've explained this potential in more detail on the chart."
The 30-minute chart shows horizontal support/resistance zones.
"In conclusion, there are many times I can look at a chart and say, "Oh yeah, the market's headed here, then here." And sure, it's possible that the rally is now in its final fifth wave at micro degree -- but as I noted previously, this move has not behaved in the usual fashion, which means this is not the type of wave where you can make reversal calls with high probability
Technical analysis is based on the idea that the market will perform in a similar fashion to the way it's performed in the past -- but when you encounter extraordinary moves, they perform almost according to their own rules, and thus do not lend themselves terribly well to anticipation. Recognizing and acknowledging that, as I covered in Wednesday's update, has value in its own right.
Happy Halloween! Trade (and keep your kids) safe."
Register for free to join our community of investors and share your ideas. You will also get access to streaming quotes, interactive charts, trades, portfolio, live options flow and more tools.
 News
News  Market Data
  Discover