


| Followers | 679 |
| Posts | 140823 |
| Boards Moderated | 36 |
| Alias Born | 03/10/2004 |
Saturday, October 25, 2014 9:03:41 PM
The Week Ahead
By Urban Carmel
* October 25, 2014
The set up coming into this week was the following: US markets experienced the most significant wash out in breadth since 2011 last week. This was accompanied by the largest spike in volatility in 3 years. Both of these factors had previously marked significant lows in equities. Moreover, SPX had been down 4 weeks in a row; in 5 of the 6 previous times this had occurred since 2009, the market was higher the following week (stat and post).
We have been discussing the recent low as being an A wave (down) in a classic ABC correction. The B wave (up) appeared to be set up last week. Above SPY 190 targeted a backtest of the 50-dma at 196 for the B wave. We imagined this taking 2-3 weeks to transpire.
Instead, it took only 6 days. SPY rose more than 5% from last Thursday's close, to end at 196.4 this week. Vix fell more than 10% three days in a row for the first time in its history.
This turned the intermediate term trend upwards. All 4 US indices and all 9 SPX sectors are above their 13-ema again. SPX also had a MACD crossover; that, combined with the 13-ema rising, has marked lows every time since December 2011. Since 2009, it has failed only two times: in June 2010 and August 2011. We remarked on Wednesday (here) that the signal had never failed immediately and so at least one higher close was expected.

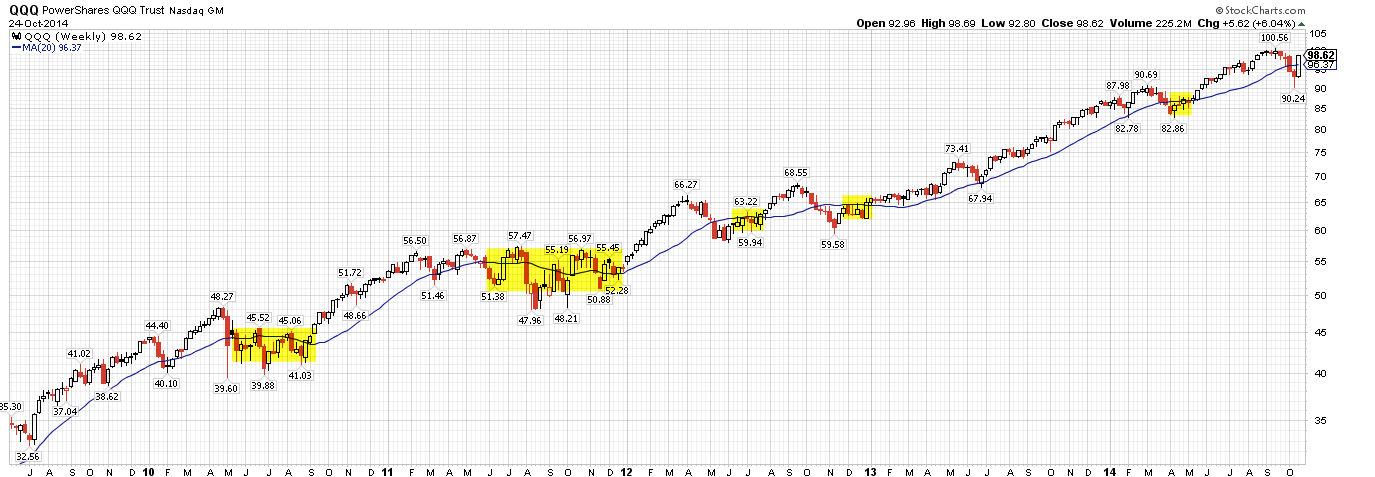
The rub to the bullish story is this: the rally the past 6 days surpassed any initial thrust out of a low the markets have seen in the past 4 years. Shown below is QQQ; the green shaded bars are all the same proportional size and equal the past 6 days' gain. In the past, the market has given back a third or more of those gains in the weeks ahead (circles). Many times, the market did not move substantially higher over the next month or longer (red line). Take June 2012, for example: the market fell further than it did recently yet it did not see gains as big as those in the past week over the next 2 months.

If past is prologue, SPX should retrace at least to 189-191. This corresponds to the Tuesday morning gap. With 2.5% (or more) downside, risk/reward does not appear to be favorable for new longs at Friday's close.
The odds of any weakness continuing into a full fledged C wave to the recent low are probably even. While this week's thrust looks impressive (and it is), it's not unprecedented. In 2011, SPX dropped 8% over several weeks. At the low, Vix and put/call ratios spiked, AAII and II bulls plummeted, and the index formed a positive momentum divergence. It looked like a very solid low. In June 2011, SPX rallied over 5% in one week, retracing more than 80% of the initial fall. So far, this is very similar to the action in SPX since the September peak. Then, over the next few weeks, SPX formed a bullish cup and handle. Instead of the uptrend continuing, the index fell to a new low. A good summary of this analogy is here.
There are two competing memes right now: one says that powerful thrusts like this week's initiate a new bull run, the other says they only happen in corrective markets (a bear market rally). Neither is correct. Over time, thrusts like these lead equally to higher and lower markets. It's not a signal, it's noise (chart from Nautilus).

QQQ and SPX both closed the week back at their 20-wma. After a 10% drop and two weekly closes below, passing back above has normally been met with at least some hesitation, sometimes more, over the next several weeks.
The same can be said for the 50-dma after a sizable (8% or more) drop. Note the set up with the MACD crossing from below in the following charts. Each prior period in the past 4 years has been followed by undulation before resolving higher. The first chart shows the past year.

Below is the same set up in 2011-12. A chart from 2010 is here. This is a large reason why we expected the 50-dma to cap the B wave rally.

It would be unusual for the markets to launch higher without some undulation first. Every significant drop in SPY since 2009 has involved up weeks (arrows) interspersed with down weeks. The current correction was the exception, 4 weeks down in a row from an ATH.

There are two additional big forces at work that will determine how markets navigate the next two weeks.
First, arguing in favor of weakness this coming week is the Wednesday FOMC meeting. The final day for the Fed's POMO program is currently expected to be on Monday ($1b in flow). The fate of this program is expected to be announced this week. Whether the effect is direct or indirect, equities are clearly in favor of continuation: Fed President Bullard's comment about pausing the program's taper launched the markets higher from Wednesday's low (story).
Former Pimco CEO Mohamed El-Erian believes, probably rightly, that the Fed will not extend QE. It's frankly hard to see the markets responding in a calm manner (story).

Arguing in favor of strength is the upcoming elections on November 4. US equities have a strong tendency to rise through election day. The table below is from Chad Gassaway. SPX has been up the week before and after mid-term elections 80% of the time since 1950.

Serious weakness following the Fed meeting Wednesday would therefore seem to be a favorable long entry into the election. Serious strength past the election, without any prior weakness, is likely to be an opportunity to sell. Mid-term election years tend to be weak into mid-November (yellow). Then comes the probable Christmas ramp into year-end.

http://fat-pitch.blogspot.com/2014/10/weekly-market-summary_25.html
George.
Click on "In reply to", for Authors past commentaries.
By Urban Carmel
* October 25, 2014
The set up coming into this week was the following: US markets experienced the most significant wash out in breadth since 2011 last week. This was accompanied by the largest spike in volatility in 3 years. Both of these factors had previously marked significant lows in equities. Moreover, SPX had been down 4 weeks in a row; in 5 of the 6 previous times this had occurred since 2009, the market was higher the following week (stat and post).
We have been discussing the recent low as being an A wave (down) in a classic ABC correction. The B wave (up) appeared to be set up last week. Above SPY 190 targeted a backtest of the 50-dma at 196 for the B wave. We imagined this taking 2-3 weeks to transpire.
Instead, it took only 6 days. SPY rose more than 5% from last Thursday's close, to end at 196.4 this week. Vix fell more than 10% three days in a row for the first time in its history.
This turned the intermediate term trend upwards. All 4 US indices and all 9 SPX sectors are above their 13-ema again. SPX also had a MACD crossover; that, combined with the 13-ema rising, has marked lows every time since December 2011. Since 2009, it has failed only two times: in June 2010 and August 2011. We remarked on Wednesday (here) that the signal had never failed immediately and so at least one higher close was expected.

The rub to the bullish story is this: the rally the past 6 days surpassed any initial thrust out of a low the markets have seen in the past 4 years. Shown below is QQQ; the green shaded bars are all the same proportional size and equal the past 6 days' gain. In the past, the market has given back a third or more of those gains in the weeks ahead (circles). Many times, the market did not move substantially higher over the next month or longer (red line). Take June 2012, for example: the market fell further than it did recently yet it did not see gains as big as those in the past week over the next 2 months.

If past is prologue, SPX should retrace at least to 189-191. This corresponds to the Tuesday morning gap. With 2.5% (or more) downside, risk/reward does not appear to be favorable for new longs at Friday's close.
The odds of any weakness continuing into a full fledged C wave to the recent low are probably even. While this week's thrust looks impressive (and it is), it's not unprecedented. In 2011, SPX dropped 8% over several weeks. At the low, Vix and put/call ratios spiked, AAII and II bulls plummeted, and the index formed a positive momentum divergence. It looked like a very solid low. In June 2011, SPX rallied over 5% in one week, retracing more than 80% of the initial fall. So far, this is very similar to the action in SPX since the September peak. Then, over the next few weeks, SPX formed a bullish cup and handle. Instead of the uptrend continuing, the index fell to a new low. A good summary of this analogy is here.
There are two competing memes right now: one says that powerful thrusts like this week's initiate a new bull run, the other says they only happen in corrective markets (a bear market rally). Neither is correct. Over time, thrusts like these lead equally to higher and lower markets. It's not a signal, it's noise (chart from Nautilus).

QQQ and SPX both closed the week back at their 20-wma. After a 10% drop and two weekly closes below, passing back above has normally been met with at least some hesitation, sometimes more, over the next several weeks.

The same can be said for the 50-dma after a sizable (8% or more) drop. Note the set up with the MACD crossing from below in the following charts. Each prior period in the past 4 years has been followed by undulation before resolving higher. The first chart shows the past year.

Below is the same set up in 2011-12. A chart from 2010 is here. This is a large reason why we expected the 50-dma to cap the B wave rally.

It would be unusual for the markets to launch higher without some undulation first. Every significant drop in SPY since 2009 has involved up weeks (arrows) interspersed with down weeks. The current correction was the exception, 4 weeks down in a row from an ATH.

There are two additional big forces at work that will determine how markets navigate the next two weeks.
First, arguing in favor of weakness this coming week is the Wednesday FOMC meeting. The final day for the Fed's POMO program is currently expected to be on Monday ($1b in flow). The fate of this program is expected to be announced this week. Whether the effect is direct or indirect, equities are clearly in favor of continuation: Fed President Bullard's comment about pausing the program's taper launched the markets higher from Wednesday's low (story).
Former Pimco CEO Mohamed El-Erian believes, probably rightly, that the Fed will not extend QE. It's frankly hard to see the markets responding in a calm manner (story).

Arguing in favor of strength is the upcoming elections on November 4. US equities have a strong tendency to rise through election day. The table below is from Chad Gassaway. SPX has been up the week before and after mid-term elections 80% of the time since 1950.

Serious weakness following the Fed meeting Wednesday would therefore seem to be a favorable long entry into the election. Serious strength past the election, without any prior weakness, is likely to be an opportunity to sell. Mid-term election years tend to be weak into mid-November (yellow). Then comes the probable Christmas ramp into year-end.

http://fat-pitch.blogspot.com/2014/10/weekly-market-summary_25.html
George.
Click on "In reply to", for Authors past commentaries.
Information posted to this board is not meant to suggest any specific action, but to point out the technical signs that can help our readers make their own specific decisions. Your Due Dilegence is a must!
gtsourdinis
Join the InvestorsHub Community
Register for free to join our community of investors and share your ideas. You will also get access to streaming quotes, interactive charts, trades, portfolio, live options flow and more tools.

