


Friday, May 02, 2014 10:31:28 AM
Pretzel update:
http://www.pretzelcharts.com/
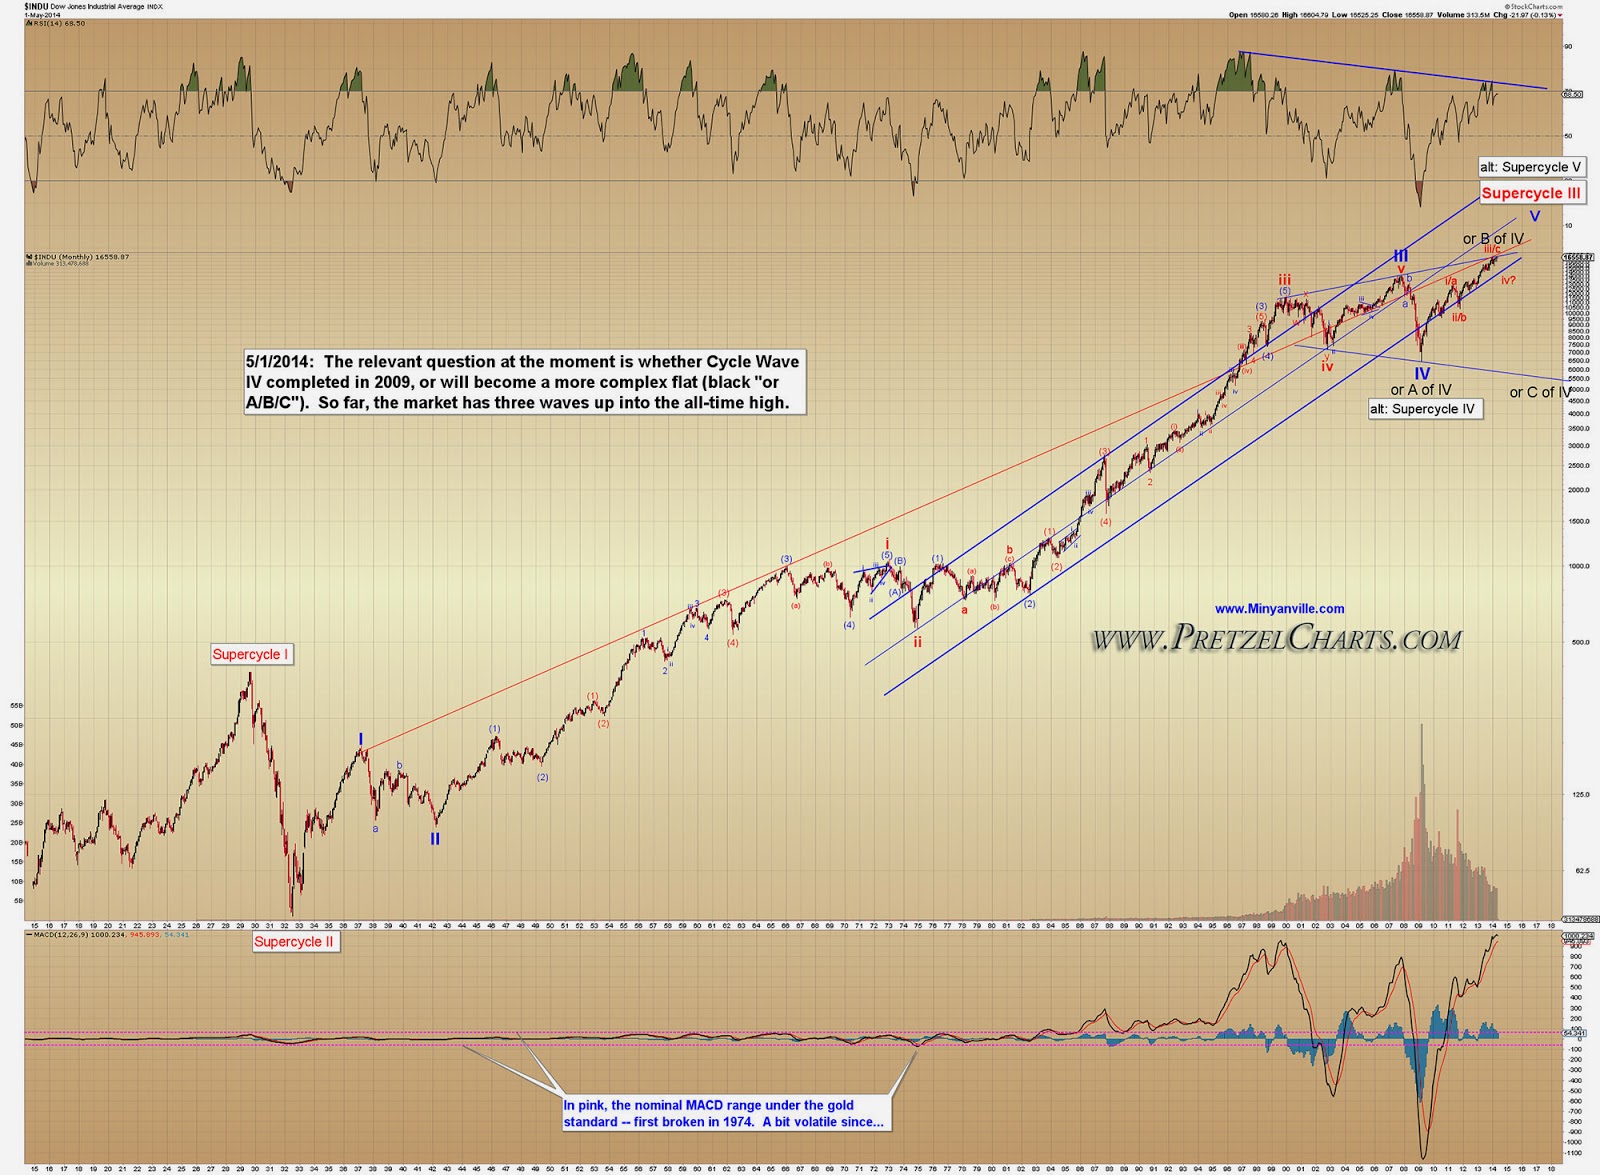
"Wednesday and Thursday's sessions consisted of much sound and fury, but very little price progress. So today, we're going to step back from the near-term, and take an in-depth look at the very-long-term wave count on the 100-year chart of the Dow Jones Industrial Average (INDU).
First, the good news: Relative to the last hundred years, it appears most likely that the market will ultimately recover from its next large correction, and continue to rise over the course of the coming decades. Okay, well, if nothing else, that's probably good news for our kids. Looking at the immediate future, though, this chart emphasizes the gravity of the current inflection point and the coming inflection point.
The current inflection point is shown in black by the "or A of IV," etc., which considers the potential of a massive expanded flat forming within the blue megaphone pattern. I first discussed this option back on February 8, 2013 (at that time, I was bullish and noted we should expect a rally toward 1750 SPX at the minimum) -- and that pattern is still on the table because there are only three rally waves complete so far (three waves is the requirement for a B-wave).
The three-wave rally makes this an inflection point. If the market breaks though that inflection point, then the assumption will be that it's currently within Cycle V of Supercycle III. In that event, the next decent correction will be a "small" (relative to the last hundred years!) fourth wave down, which would be labeled as red iv. From there, the market would ultimately rally to new highs, in Primary (red) v of Cycle (blue) V. That scenario would put the true end of the bull market out at least a year or two into the future. At the end, though, things would have the potential to get very ugly.
Once Cycle V completes, we'll enter a massive fourth wave correction at Supercycle degree. How massive? Well, this pending Supercycle fourth wave would pair with the 1929 crash. The chart shown below is in logarithmic scale -- which is really the only way to view a century-long price chart in context -- and notice that the 2007-2009 bear market (as nasty as it was) was only a hiccup relative to the 1929 crash. Supercycle IV would likely make 2007-2009 appear mild in comparison.
That's still a ways off, though -- so no reason to stock up the bomb shelter with extra Fig Newtons just yet (actually, there's no reason to stock the bomb shelter with Fig Newtons at all) -- and the good news is that we should ultimately recover from Supercycle IV in the Supercycle V rally.
The more immediate concern revolves around the potential for the recent bull market to be B of IV, and to complete in the relatively near future. A c-wave decline at Cycle degree would certainly not be something to take lightly.
The temptation with charts like this is to focus on the negative, and I would strongly caution against that approach. If the market is going to form a c-wave decline at Cycle degree, then it's not going to Dow 5000 tomorrow. It's going to take some time to get rolling, and there should be ample warnings along the way. In the interim, let's stay open to both possibilities: We've all seen what the "perma-bear" approach can do to investors, and it isn't pretty.
An interesting side note about the chart below is the way price resistance and RSI resistance have collided near the market's recent levels. I should also note that, in the past, I've referred to 2009 as the bottom of Supercycle IV, but I've shown that as the alternate count on this chart. I'm pretty evenly split on the two options.
(If you're new to Elliott Wave analysis, understanding this chart would be aided by my quick primer on the subject: Technical Analysis: Understanding Elliott Wave Theory)"
"Let's take another look at the Russell 2000 (RUT) chart, which shows the small caps remain in an intermediate down trend. Investors are still avoiding risk and, as I discussed on April 23, this represents a marked shift in the market's behavior from 2013. This is one of the reasons I've been advocating caution recently."

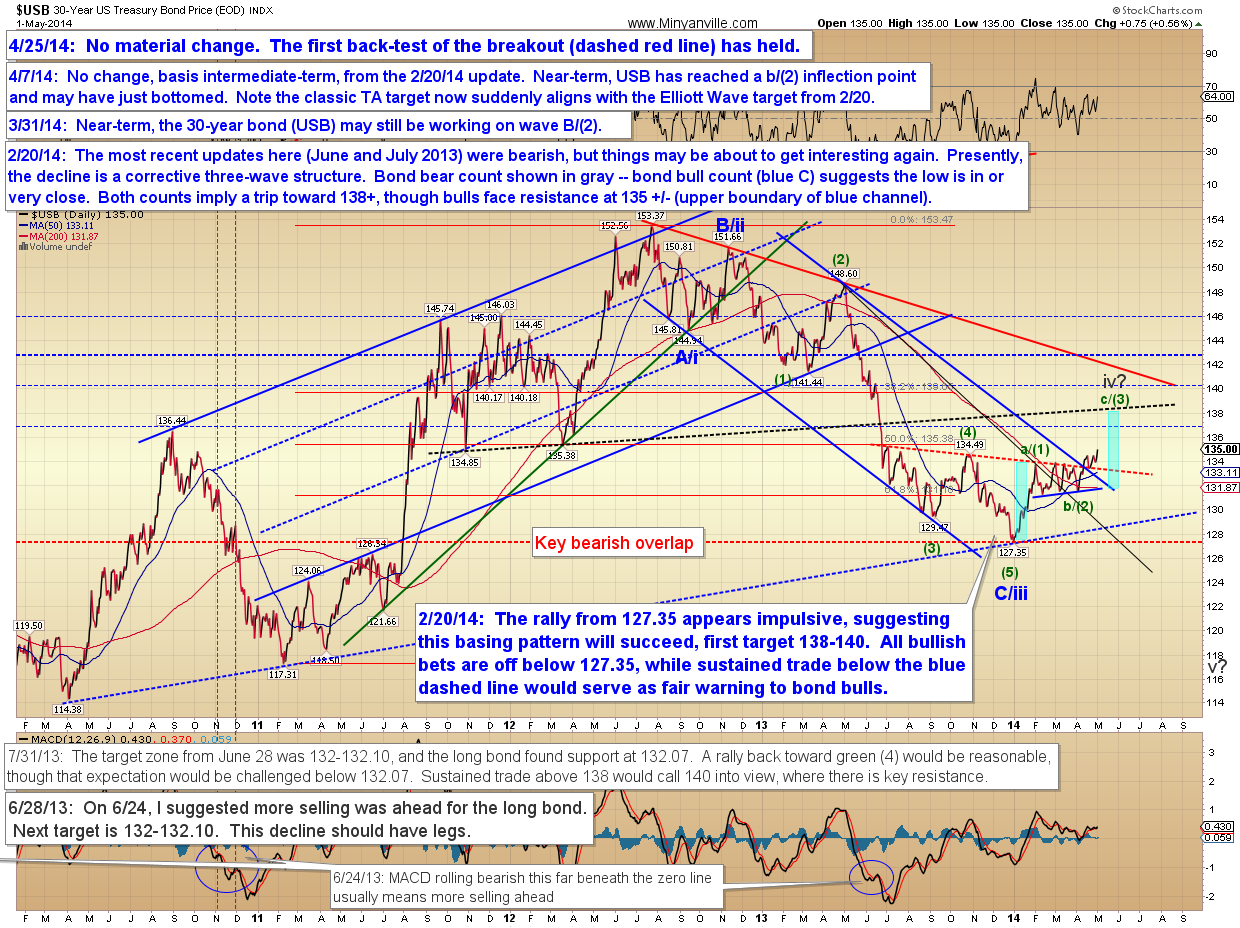
"Back in February, I turned unequivocally bullish on the long bond, and more than a few folks thought I was nuts. But in the meantime, the long bond has continued to outperform, and appears headed for my targets. This is another reason I've been advocating caution in equities."
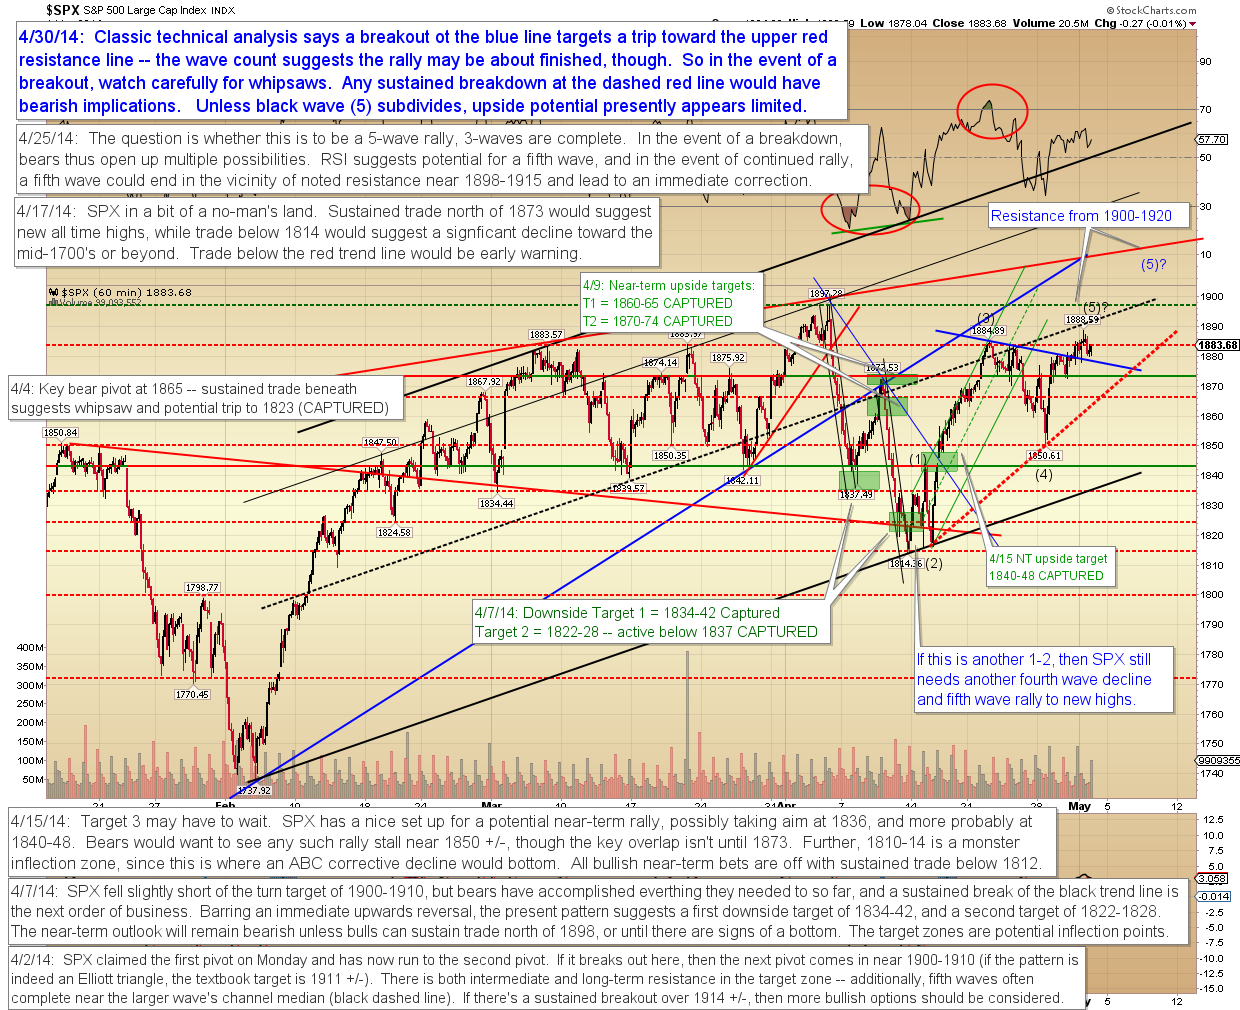
"Recently, I've observed a lot of traders shifting back and forth from bullish to bearish and vice-versa, which is a function of the trading range that blue chip equities have been stuck in for the past few months. Trading ranges can really play on a trader's emotions -- which is why "neutral" is sometimes the best stance when the picture gets muddy. Always remember that cash is a position, too; it's usually better to be "out wishing you were in," than "in wishing you were out."
When I look at the current chart of the S&P 500 (SPX), I view it as a fool's errand trying to assign probability to the patterns that have emerged from within this large trading range, since I've learned over the years that giving too much credence to patterns that form within a range is often a losing proposition. So I apologize to readers if that's frustrating at the moment, but I'd rather say nothing than make a hard call that's patently ill-advised.
So, near-term, here are the main options, for what they're worth: There are enough waves in place for the rally to be complete, though there may be one additional fourth wave decline and fifth wave rally pending. At this point, I'd almost rather see the latter, which would lead to a near-term decline, followed by a trip into the 1905-1920 zone (to get the trend chasers back on board, and to get everyone to forget about "sell in May and go away"), followed by a surprise whipsaw into an intermediate correction. But frankly, none of my systems, signals, or indicators are giving me a solid answer one way or another here."
"In conclusion: At the present moment, the song remains the same as it has over the past week or so, and the message from equities is still "caution." If you held my feet to the fire, I'd say I'm more inclined to be intermediate bearish here than intermediate bullish, based on the weight of the current evidence. Ultimately, I'm simply patiently waiting for the market to give us a more solid signal. Trade safe."
Follow me on Twitter while I try to figure out exactly how to make practical use of Twitter:
@PretzelLogic
http://www.pretzelcharts.com/
"Wednesday and Thursday's sessions consisted of much sound and fury, but very little price progress. So today, we're going to step back from the near-term, and take an in-depth look at the very-long-term wave count on the 100-year chart of the Dow Jones Industrial Average (INDU).
First, the good news: Relative to the last hundred years, it appears most likely that the market will ultimately recover from its next large correction, and continue to rise over the course of the coming decades. Okay, well, if nothing else, that's probably good news for our kids. Looking at the immediate future, though, this chart emphasizes the gravity of the current inflection point and the coming inflection point.
The current inflection point is shown in black by the "or A of IV," etc., which considers the potential of a massive expanded flat forming within the blue megaphone pattern. I first discussed this option back on February 8, 2013 (at that time, I was bullish and noted we should expect a rally toward 1750 SPX at the minimum) -- and that pattern is still on the table because there are only three rally waves complete so far (three waves is the requirement for a B-wave).
The three-wave rally makes this an inflection point. If the market breaks though that inflection point, then the assumption will be that it's currently within Cycle V of Supercycle III. In that event, the next decent correction will be a "small" (relative to the last hundred years!) fourth wave down, which would be labeled as red iv. From there, the market would ultimately rally to new highs, in Primary (red) v of Cycle (blue) V. That scenario would put the true end of the bull market out at least a year or two into the future. At the end, though, things would have the potential to get very ugly.
Once Cycle V completes, we'll enter a massive fourth wave correction at Supercycle degree. How massive? Well, this pending Supercycle fourth wave would pair with the 1929 crash. The chart shown below is in logarithmic scale -- which is really the only way to view a century-long price chart in context -- and notice that the 2007-2009 bear market (as nasty as it was) was only a hiccup relative to the 1929 crash. Supercycle IV would likely make 2007-2009 appear mild in comparison.
That's still a ways off, though -- so no reason to stock up the bomb shelter with extra Fig Newtons just yet (actually, there's no reason to stock the bomb shelter with Fig Newtons at all) -- and the good news is that we should ultimately recover from Supercycle IV in the Supercycle V rally.
The more immediate concern revolves around the potential for the recent bull market to be B of IV, and to complete in the relatively near future. A c-wave decline at Cycle degree would certainly not be something to take lightly.
The temptation with charts like this is to focus on the negative, and I would strongly caution against that approach. If the market is going to form a c-wave decline at Cycle degree, then it's not going to Dow 5000 tomorrow. It's going to take some time to get rolling, and there should be ample warnings along the way. In the interim, let's stay open to both possibilities: We've all seen what the "perma-bear" approach can do to investors, and it isn't pretty.
An interesting side note about the chart below is the way price resistance and RSI resistance have collided near the market's recent levels. I should also note that, in the past, I've referred to 2009 as the bottom of Supercycle IV, but I've shown that as the alternate count on this chart. I'm pretty evenly split on the two options.
(If you're new to Elliott Wave analysis, understanding this chart would be aided by my quick primer on the subject: Technical Analysis: Understanding Elliott Wave Theory)"

"Let's take another look at the Russell 2000 (RUT) chart, which shows the small caps remain in an intermediate down trend. Investors are still avoiding risk and, as I discussed on April 23, this represents a marked shift in the market's behavior from 2013. This is one of the reasons I've been advocating caution recently."

"Back in February, I turned unequivocally bullish on the long bond, and more than a few folks thought I was nuts. But in the meantime, the long bond has continued to outperform, and appears headed for my targets. This is another reason I've been advocating caution in equities."

"Recently, I've observed a lot of traders shifting back and forth from bullish to bearish and vice-versa, which is a function of the trading range that blue chip equities have been stuck in for the past few months. Trading ranges can really play on a trader's emotions -- which is why "neutral" is sometimes the best stance when the picture gets muddy. Always remember that cash is a position, too; it's usually better to be "out wishing you were in," than "in wishing you were out."
When I look at the current chart of the S&P 500 (SPX), I view it as a fool's errand trying to assign probability to the patterns that have emerged from within this large trading range, since I've learned over the years that giving too much credence to patterns that form within a range is often a losing proposition. So I apologize to readers if that's frustrating at the moment, but I'd rather say nothing than make a hard call that's patently ill-advised.
So, near-term, here are the main options, for what they're worth: There are enough waves in place for the rally to be complete, though there may be one additional fourth wave decline and fifth wave rally pending. At this point, I'd almost rather see the latter, which would lead to a near-term decline, followed by a trip into the 1905-1920 zone (to get the trend chasers back on board, and to get everyone to forget about "sell in May and go away"), followed by a surprise whipsaw into an intermediate correction. But frankly, none of my systems, signals, or indicators are giving me a solid answer one way or another here."

"In conclusion: At the present moment, the song remains the same as it has over the past week or so, and the message from equities is still "caution." If you held my feet to the fire, I'd say I'm more inclined to be intermediate bearish here than intermediate bullish, based on the weight of the current evidence. Ultimately, I'm simply patiently waiting for the market to give us a more solid signal. Trade safe."
Follow me on Twitter while I try to figure out exactly how to make practical use of Twitter:
@PretzelLogic
Join the InvestorsHub Community
Register for free to join our community of investors and share your ideas. You will also get access to streaming quotes, interactive charts, trades, portfolio, live options flow and more tools.

