


Monday, April 07, 2014 12:16:54 PM
Pretzel update:
http://www.pretzelcharts.com/
"Friday saw an ugly bearish reversal day, which likely caught most traders wrong-footed (the majority generally have to be looking the wrong direction for solid market moves to happen in the first place). Bearish reversal days thus typically portend further selling ahead, since many traders who were trapped at the highs will look to unload longs into the next bounce, and this creates overhead resistance.
I wrote about this setup on March 31, and added this on Wednesday, April 2:
If the market is indeed plotting the head-fake whipsaw I talked about on Monday, then we're likely to see a significant sell-off afterwards, as most traders will be caught wrong-footed. This is because classic technical analysis would see a breakout here as very bullish, with targets in the mid-to-high 1900's.
The above paragraph also indirectly describes one of the reasons I feel Elliott Wave Theory is an invaluable tool for trading and market analysis. Back on March 31, Elliott Wave allowed me to project that the S&P 500 (SPX) would likely rally directly out of the range, in a false-breakout, which would then reverse (See: SPX and USB: Equities May Be Plotting a Head-fake Whipsaw). Without Elliott Wave, I probably wouldn't have been able to foresee all that -- especially from the vantage point presented before the breakout had even occurred.
Being aware of the likelihood of a pending reversal can be invaluable for protecting profits on existing positions, and/or for avoiding badly-timed entries on new positions. Of course, one must carefully balance projections with real-time market feedback, and continue to respond to changing conditions in a fluid manner. The "danger" of projecting the future is that one can become too rigid in one's expectations, and thus fail to recognize either opportunities or perils in the present moment. But ultimately, "forewarned is forearmed" as they say -- so I think if one can balance foreknowledge of likely potentials with a present-based trading approach (and, of course, solid risk management), then it creates many more opportunities for protection and expansion of capital.
Moving on to the current charts, I'd like to start off with a detailed look at the Nasdaq Composite (COMPQ). As I noted on Friday, the higher beta indices like COMPQ and Russell 2000 (RUT) weren't playing along with the SPX rally. That's sometimes a warning that sentiment is shifting toward risk-off. Looking forward, COMPQ's current pattern has a markedly bearish appearance, and is suggestive of a nested third wave decline ("nested" meaning a third wave within a third wave). This chart tells me I'm not in a hurry to "buy the dip" just yet, because there is still significant downside potential present."

"In SPX, so far bears have accomplished everything they needed to, short of a sustained break of the black trend line. The near-term outlook will remain bearish until either 1898 is claimed to the upside, or until there are signs of a bottom.
Notice SPX is currently in a near-term crash channel (the thin black channel) -- the first step for bulls is to break out over the upper boundary, but usually the first break of a channel this steep is merely a deceleration of the near-term trend, as opposed to an immediate reversal. So, more often than not, the first breakout is then sold to new lows. Consequently, there is almost no reason to bet against the near-term trend when the market's still within such a channel -- so again, I see no reason to be in a hurry to get long, as of this exact moment."
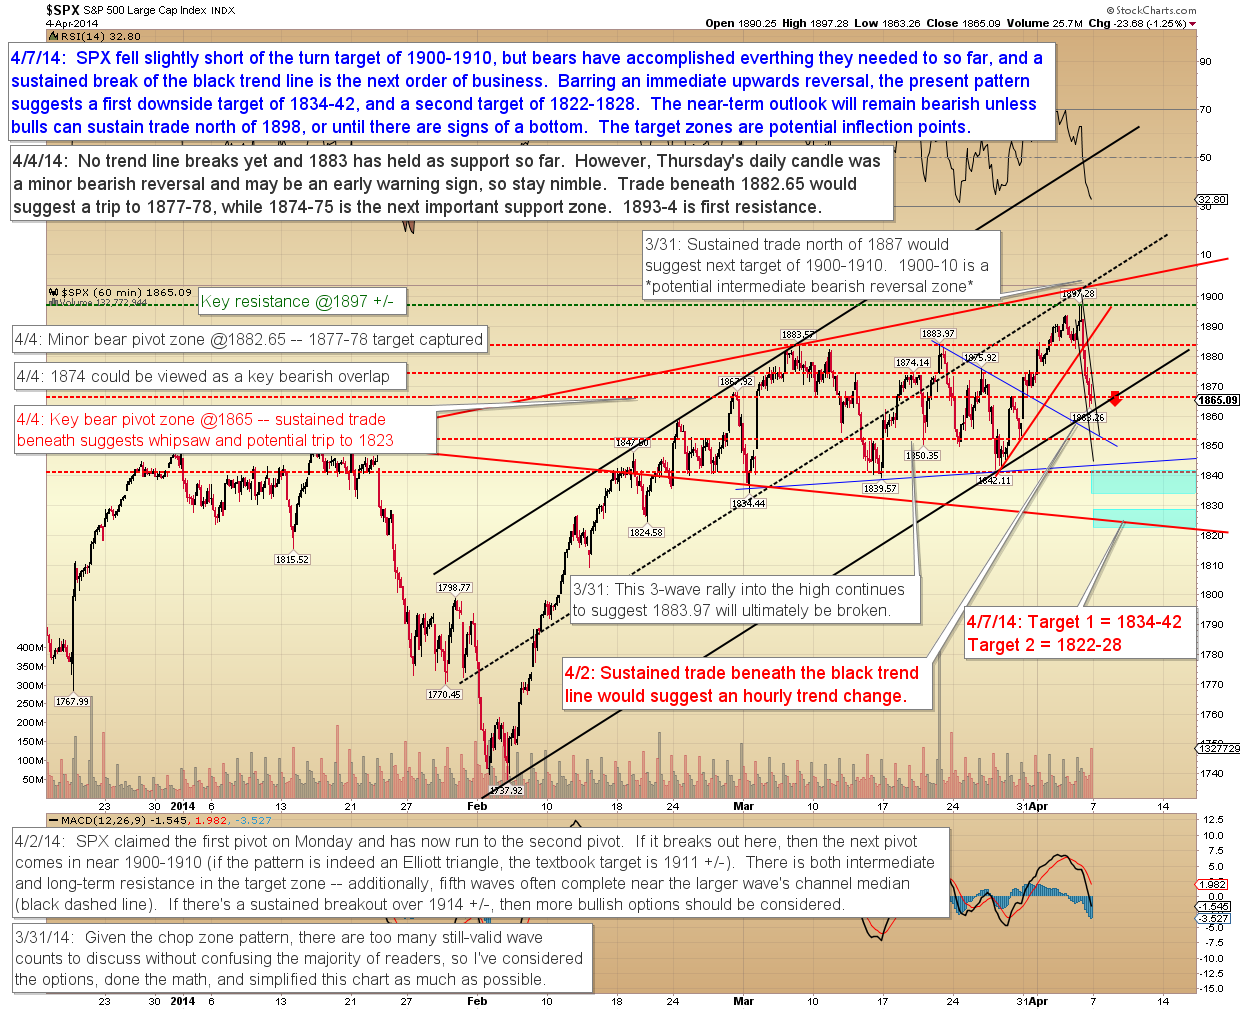
"Looking forward on SPX, the target zones also represent inflection points, which means we'll be wise to observe how the market reacts to them (assuming they're reached, of course!). One ugly day can't tell us if this decline will be an intermediate decline or not, though it does have all the ingredients for one. Intermediate decline or not, on a near-term basis, this drop shows no signs yet of an impending bottom; so I think any pending bottoms will need to come from lower prices.
Not shown today is the NYSE Composite (NYA): On Friday, NYA rallied into its median channel line, then reversed from that line, almost to-the-penny. I'd noted on the chart that we should watch that zone carefully, because "fifth waves often stall near median channel lines" (just another reason why my first love in charting is still Elliott Wave Theory).
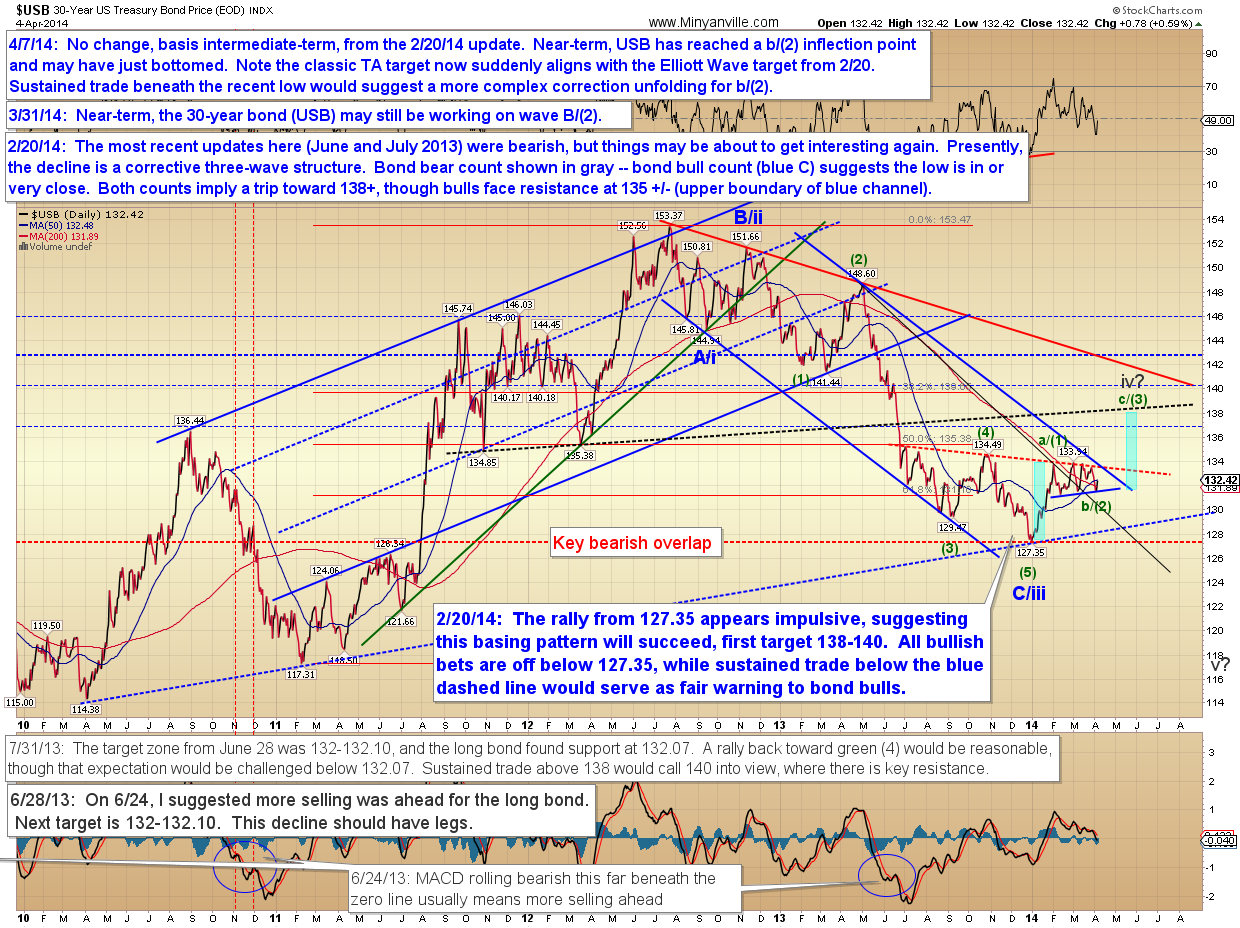
In place of NYA, which appears it will follow a similar path as SPX and would thus be redundant today, we'll take another look at the 30-year bond (USB). USB has reached a near-term inflection point for wave b/(2), meaning the long-bond appears likely to have bottomed in the recent session. If so, it's now embarking on wave c/(3). Interestingly, if there's a breakout over the dashed red trend line, then classic technical analysis would view USB as a flag pattern -- and the target for this classic TA flag pattern now aligns with the 138 Elliott Wave target from February 20 (more aggressive TA methodology would actually suggest a target beyond 139).
Stocks and bonds have demonstrated an inverse correlation at many points in the past, and have shown this correlation with some consistency since 2012 -- so a rally in bonds would hint at trouble for equities. The key for bond bulls, of course, is a breakout over the red resistance line; while a breakdown of the recent lows would suggest a more complex correction still unfolding for b/(2)."
"In conclusion, Friday's reversal came within a couple points of the projected reversal zone, and was strong enough to suggest that the head-fake whipsaw thesis was indeed correct. Last week thus made an excellent bull trap, and almost certainly caught the majority of traders looking the wrong direction, since the upside breakout from March's extended range-bound consolidation is something many trading systems would have viewed as bullish, especially in light of the strong bull run that preceded it.
In my experience, trader psychology is subject to the laws of inertia -- so the initial tendency of traders who were bullish last week will be to remain bullish into the decline this week, possibly leading to premature dip-buying. Regarding this psychological component, I'd like to quickly refer back to something I wrote on Wednesday, April 2:
I think one of the goals of trading ranges is to wear everyone out -- and in doing so, ranges sometimes serve the function of making traders a bit sloppy afterwards. While the range is underway, everyone becomes hyper-focused on the near-term charts; then some feel thrilled or relieved when the range finally breaks. Trend followers sometimes even become strangely complacent afterwards, due to the emotional release of stored tension that was generated by the range.
Based on some of the trader talk I heard last week, I suspect there was a lot of "release of tension" complacency in the wake of the breakout (sometimes this "I weathered the correction!" psychological relief even reaches extremes, and manifests as arrogance). Thus it appears there was significant complacency at the all-time high, which means many traders were positioned "long and wrong" on Friday -- and that makes this a great setup for a continued sell-off. In the meantime, we'll rely on real-time feedback from the price charts to tell us when buying the dip might again see better odds. Trade safe."
Follow me on Twitter while I try to figure out exactly how to make practical use of Twitter:
@PretzelLogic
http://www.pretzelcharts.com/
"Friday saw an ugly bearish reversal day, which likely caught most traders wrong-footed (the majority generally have to be looking the wrong direction for solid market moves to happen in the first place). Bearish reversal days thus typically portend further selling ahead, since many traders who were trapped at the highs will look to unload longs into the next bounce, and this creates overhead resistance.
I wrote about this setup on March 31, and added this on Wednesday, April 2:
If the market is indeed plotting the head-fake whipsaw I talked about on Monday, then we're likely to see a significant sell-off afterwards, as most traders will be caught wrong-footed. This is because classic technical analysis would see a breakout here as very bullish, with targets in the mid-to-high 1900's.
The above paragraph also indirectly describes one of the reasons I feel Elliott Wave Theory is an invaluable tool for trading and market analysis. Back on March 31, Elliott Wave allowed me to project that the S&P 500 (SPX) would likely rally directly out of the range, in a false-breakout, which would then reverse (See: SPX and USB: Equities May Be Plotting a Head-fake Whipsaw). Without Elliott Wave, I probably wouldn't have been able to foresee all that -- especially from the vantage point presented before the breakout had even occurred.
Being aware of the likelihood of a pending reversal can be invaluable for protecting profits on existing positions, and/or for avoiding badly-timed entries on new positions. Of course, one must carefully balance projections with real-time market feedback, and continue to respond to changing conditions in a fluid manner. The "danger" of projecting the future is that one can become too rigid in one's expectations, and thus fail to recognize either opportunities or perils in the present moment. But ultimately, "forewarned is forearmed" as they say -- so I think if one can balance foreknowledge of likely potentials with a present-based trading approach (and, of course, solid risk management), then it creates many more opportunities for protection and expansion of capital.
Moving on to the current charts, I'd like to start off with a detailed look at the Nasdaq Composite (COMPQ). As I noted on Friday, the higher beta indices like COMPQ and Russell 2000 (RUT) weren't playing along with the SPX rally. That's sometimes a warning that sentiment is shifting toward risk-off. Looking forward, COMPQ's current pattern has a markedly bearish appearance, and is suggestive of a nested third wave decline ("nested" meaning a third wave within a third wave). This chart tells me I'm not in a hurry to "buy the dip" just yet, because there is still significant downside potential present."

"In SPX, so far bears have accomplished everything they needed to, short of a sustained break of the black trend line. The near-term outlook will remain bearish until either 1898 is claimed to the upside, or until there are signs of a bottom.
Notice SPX is currently in a near-term crash channel (the thin black channel) -- the first step for bulls is to break out over the upper boundary, but usually the first break of a channel this steep is merely a deceleration of the near-term trend, as opposed to an immediate reversal. So, more often than not, the first breakout is then sold to new lows. Consequently, there is almost no reason to bet against the near-term trend when the market's still within such a channel -- so again, I see no reason to be in a hurry to get long, as of this exact moment."

"Looking forward on SPX, the target zones also represent inflection points, which means we'll be wise to observe how the market reacts to them (assuming they're reached, of course!). One ugly day can't tell us if this decline will be an intermediate decline or not, though it does have all the ingredients for one. Intermediate decline or not, on a near-term basis, this drop shows no signs yet of an impending bottom; so I think any pending bottoms will need to come from lower prices.
Not shown today is the NYSE Composite (NYA): On Friday, NYA rallied into its median channel line, then reversed from that line, almost to-the-penny. I'd noted on the chart that we should watch that zone carefully, because "fifth waves often stall near median channel lines" (just another reason why my first love in charting is still Elliott Wave Theory).
In place of NYA, which appears it will follow a similar path as SPX and would thus be redundant today, we'll take another look at the 30-year bond (USB). USB has reached a near-term inflection point for wave b/(2), meaning the long-bond appears likely to have bottomed in the recent session. If so, it's now embarking on wave c/(3). Interestingly, if there's a breakout over the dashed red trend line, then classic technical analysis would view USB as a flag pattern -- and the target for this classic TA flag pattern now aligns with the 138 Elliott Wave target from February 20 (more aggressive TA methodology would actually suggest a target beyond 139).
Stocks and bonds have demonstrated an inverse correlation at many points in the past, and have shown this correlation with some consistency since 2012 -- so a rally in bonds would hint at trouble for equities. The key for bond bulls, of course, is a breakout over the red resistance line; while a breakdown of the recent lows would suggest a more complex correction still unfolding for b/(2)."

"In conclusion, Friday's reversal came within a couple points of the projected reversal zone, and was strong enough to suggest that the head-fake whipsaw thesis was indeed correct. Last week thus made an excellent bull trap, and almost certainly caught the majority of traders looking the wrong direction, since the upside breakout from March's extended range-bound consolidation is something many trading systems would have viewed as bullish, especially in light of the strong bull run that preceded it.
In my experience, trader psychology is subject to the laws of inertia -- so the initial tendency of traders who were bullish last week will be to remain bullish into the decline this week, possibly leading to premature dip-buying. Regarding this psychological component, I'd like to quickly refer back to something I wrote on Wednesday, April 2:
I think one of the goals of trading ranges is to wear everyone out -- and in doing so, ranges sometimes serve the function of making traders a bit sloppy afterwards. While the range is underway, everyone becomes hyper-focused on the near-term charts; then some feel thrilled or relieved when the range finally breaks. Trend followers sometimes even become strangely complacent afterwards, due to the emotional release of stored tension that was generated by the range.
Based on some of the trader talk I heard last week, I suspect there was a lot of "release of tension" complacency in the wake of the breakout (sometimes this "I weathered the correction!" psychological relief even reaches extremes, and manifests as arrogance). Thus it appears there was significant complacency at the all-time high, which means many traders were positioned "long and wrong" on Friday -- and that makes this a great setup for a continued sell-off. In the meantime, we'll rely on real-time feedback from the price charts to tell us when buying the dip might again see better odds. Trade safe."
Follow me on Twitter while I try to figure out exactly how to make practical use of Twitter:
@PretzelLogic
Join the InvestorsHub Community
Register for free to join our community of investors and share your ideas. You will also get access to streaming quotes, interactive charts, trades, portfolio, live options flow and more tools.

