 News
News  Market Data
  Discover
Support: 888-992-3836
Copyright © 2023 InvestorsHub Inc.


Attempting to add nano-particles of (K) to bottle of bucky-ball (C)60 to make it float in air..what are you doing?
tothe
![]()
Attempting to add nano-particles of (K) to bottle of bucky-ball (C)60 to make it float in air..what are you doing?
Register for free to join our community of investors and share your ideas. You will also get access to streaming quotes, interactive charts, trades, portfolio, live options flow and more tools.
Register for free to join our community of investors and share your ideas. You will also get access to streaming quotes, interactive charts, trades, portfolio, live options flow and more tools.
Attempting to add nano-particles of (K) to bottle of bucky-ball (C)60 to make it float in air..what are you doing?
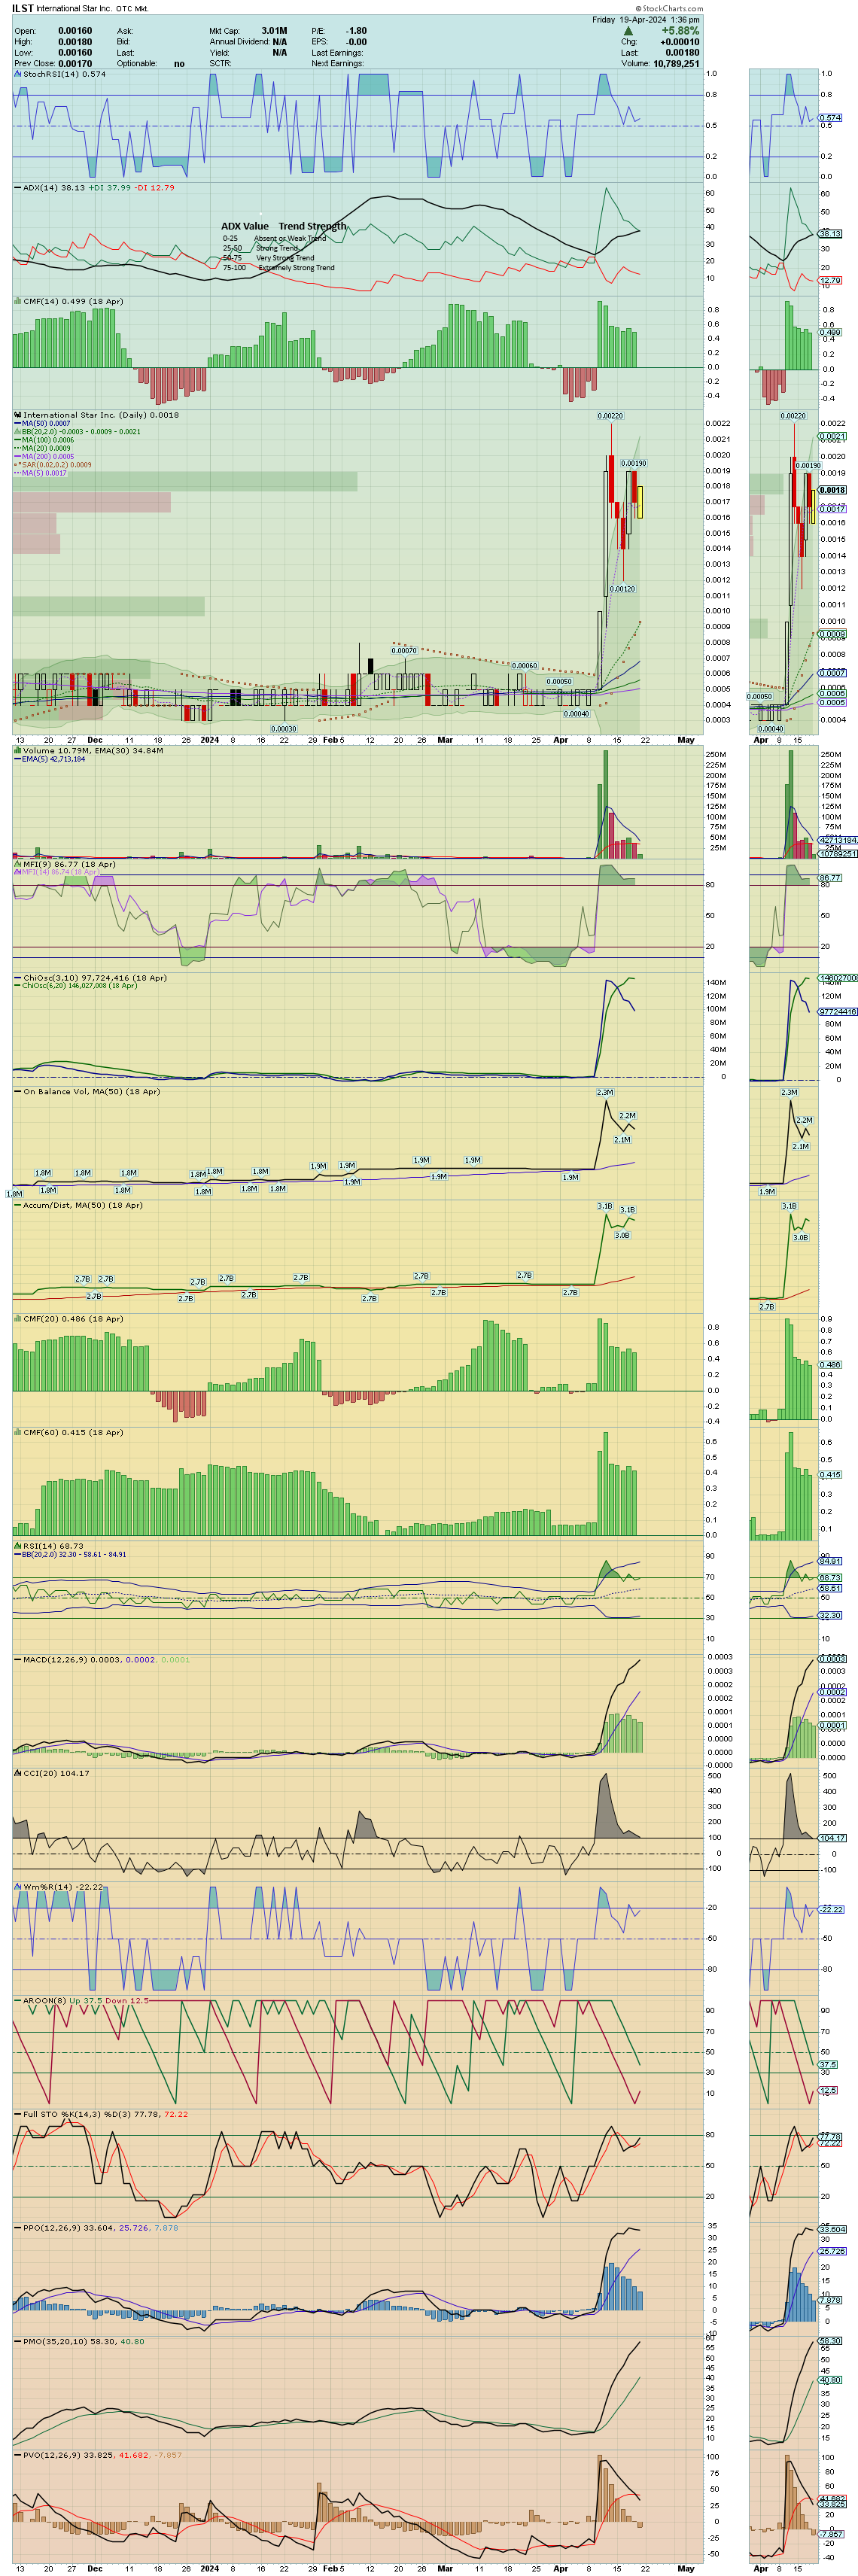
No one selling at .02, we have a 24:1 buy to sell ratio today. I pitched in with my usual $50 buy on trade# 8 and snagged a 2,600 share hidden ask.,,, now who was lurking down there, the ghost in the MM algo?
ILST warrants: This is all I could find, I think they are restricted from us common folks to trade.
 American Warrants - Cusip/ISIN Numbers
 ILST	international star inc	460371206	US4603712062
 http://canadianwarrants.com/us/cusip-numbers/a-z/i7.html
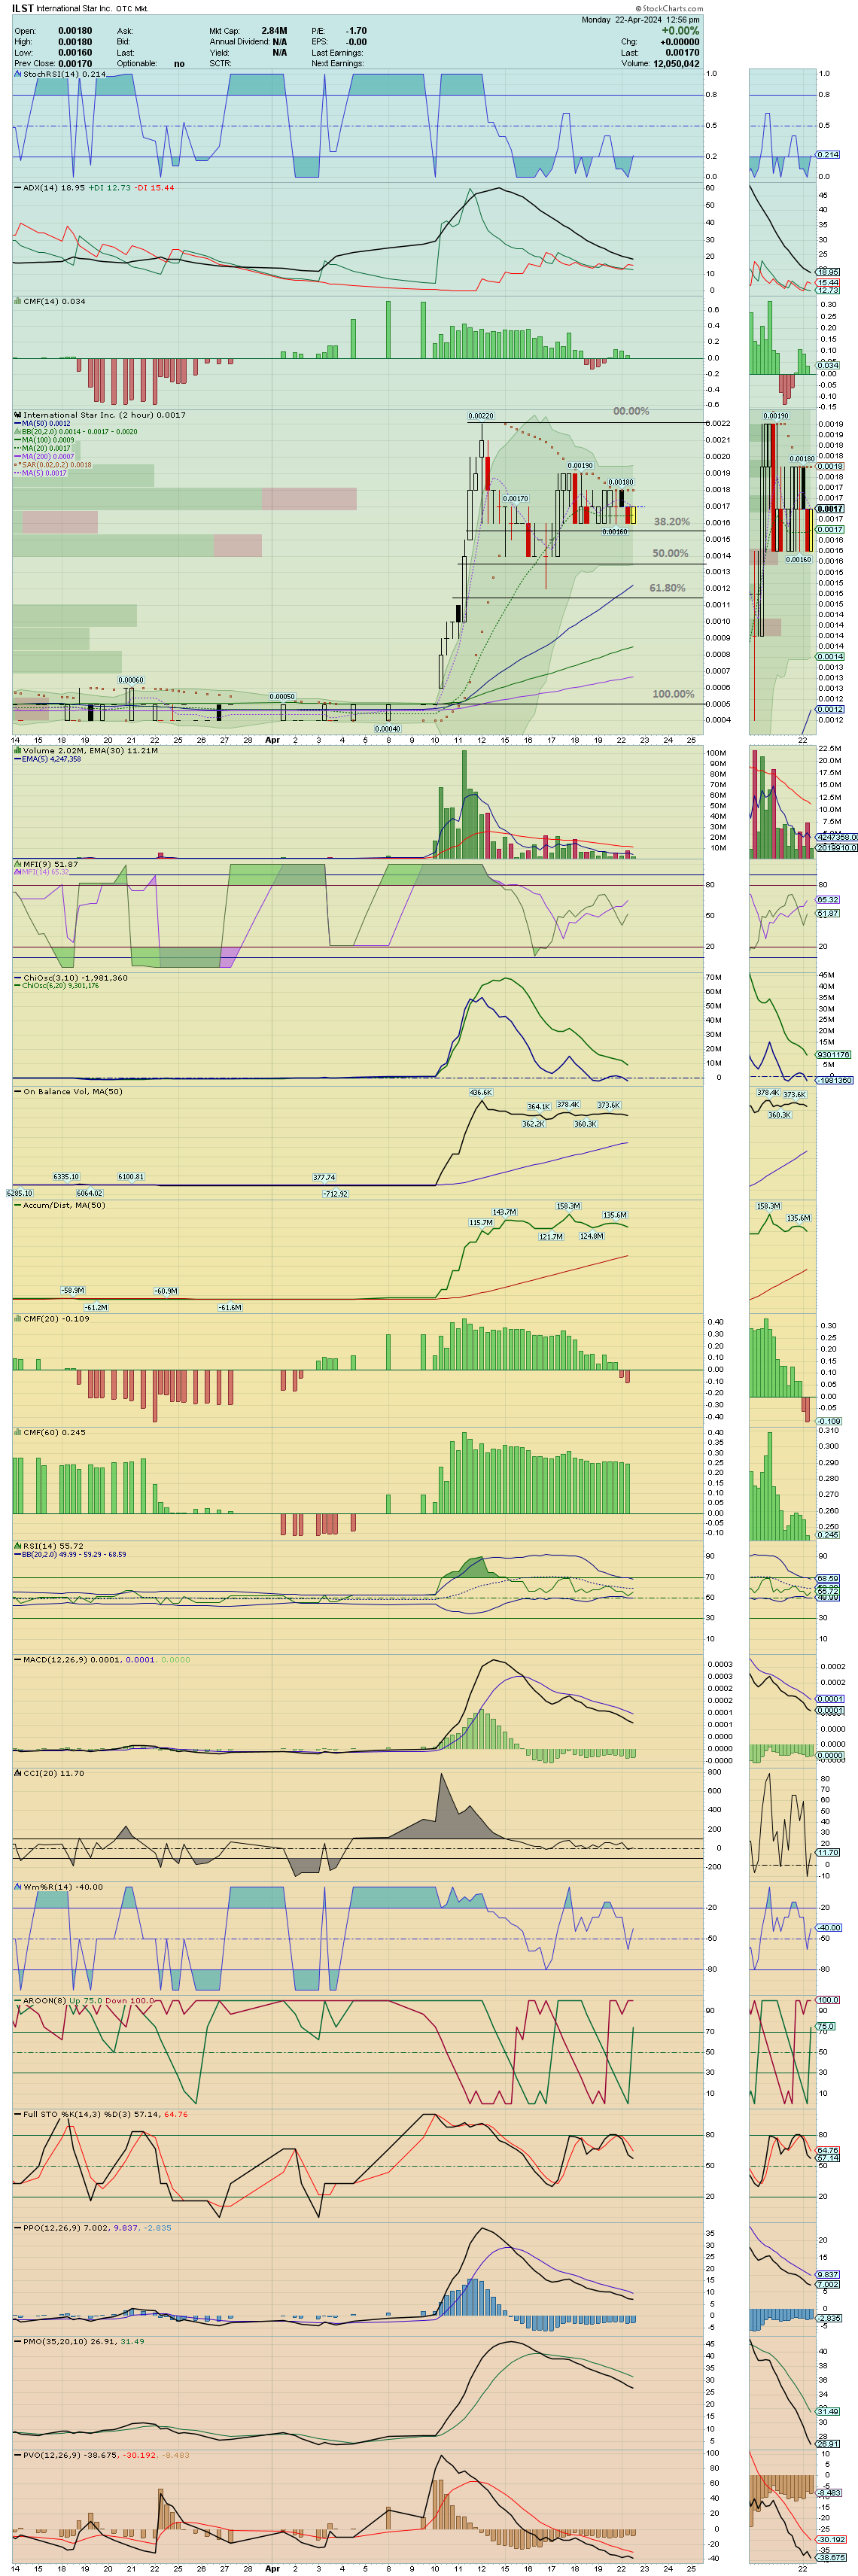
ILST 2hr.chart~~~ A view of our retracement, the continuation flag and the Measured Move trading range step #1 setup. We may be getting a head start on BB pinch #2 that will eventually show up on the daily.
~~~ Our Primary Trend Up is showing 50/100/200 Moving Average 'pancake' stack complementing what is seen on the daily chart. You guys don't need BarChart to see all this stuff. 
* A brief on chart Indicators
https://investorshub.advfn.com/boards/read_msg.aspx?message_id=146368673
chart & TA post thread
https://thepatternsite.com/mmu.html
https://thepatternsite.com/VerticalRunUp.html
https://thepatternsite.com/htf.html
https://school.stockcharts.com/doku.php?id=chart_analysis:chart_patterns:flag_pennant_continuation
https://stockcharts.com/h-sc/ui?s=ILST&p=D&yr=0&mn=5&dy=10&id=p24986097784&listNum=23&a=1113701411
Edited IBOX in regard to 'Shell Risk' removal. Keeping historical "yoyo record" of all the changes to share structure.
Sticky expedited. I got the Info BOX running, need more box candy DD to work on construction.
ILST weekly charts~~~ Still need convincing that we are in a continuation pattern???
* Breakout week flag has a long tailed doji showing vey serious seller flushing all week. After a 50% retracement from previous week on lighter volume we have a perfect setup for buyers to do their thing on a new but higher trading floor.
chart & TA post thread
https://stockcharts.com/h-sc/ui?s=ILST&p=W&yr=0&mn=11&dy=30&id=p85023291209
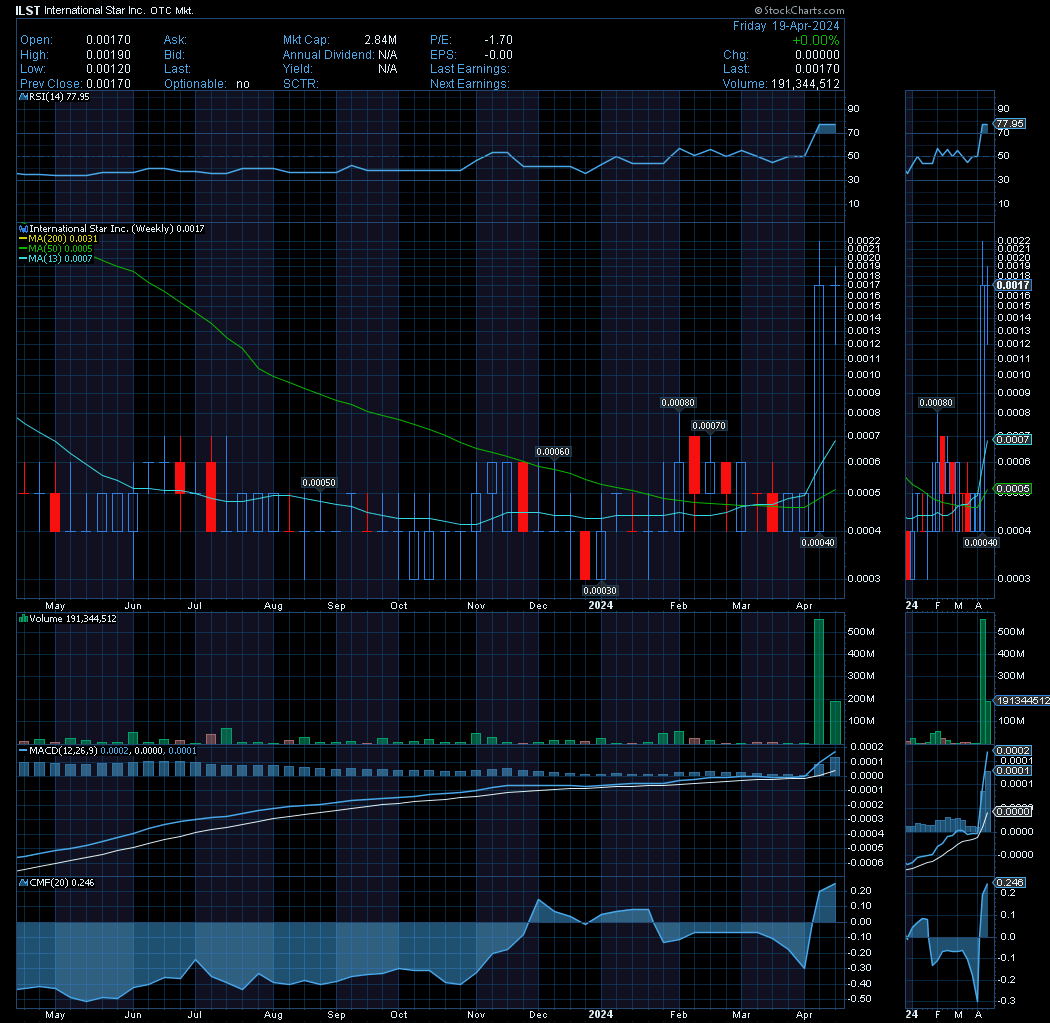
~~~ Our median retrace was by the book. 
https://thepatternsite.com/VerticalRunUp.html
https://stockcharts.com/h-sc/ui?s=ILST&p=W&yr=1&mn=6&dy=0&id=p24986097784&listNum=23&a=1113701411
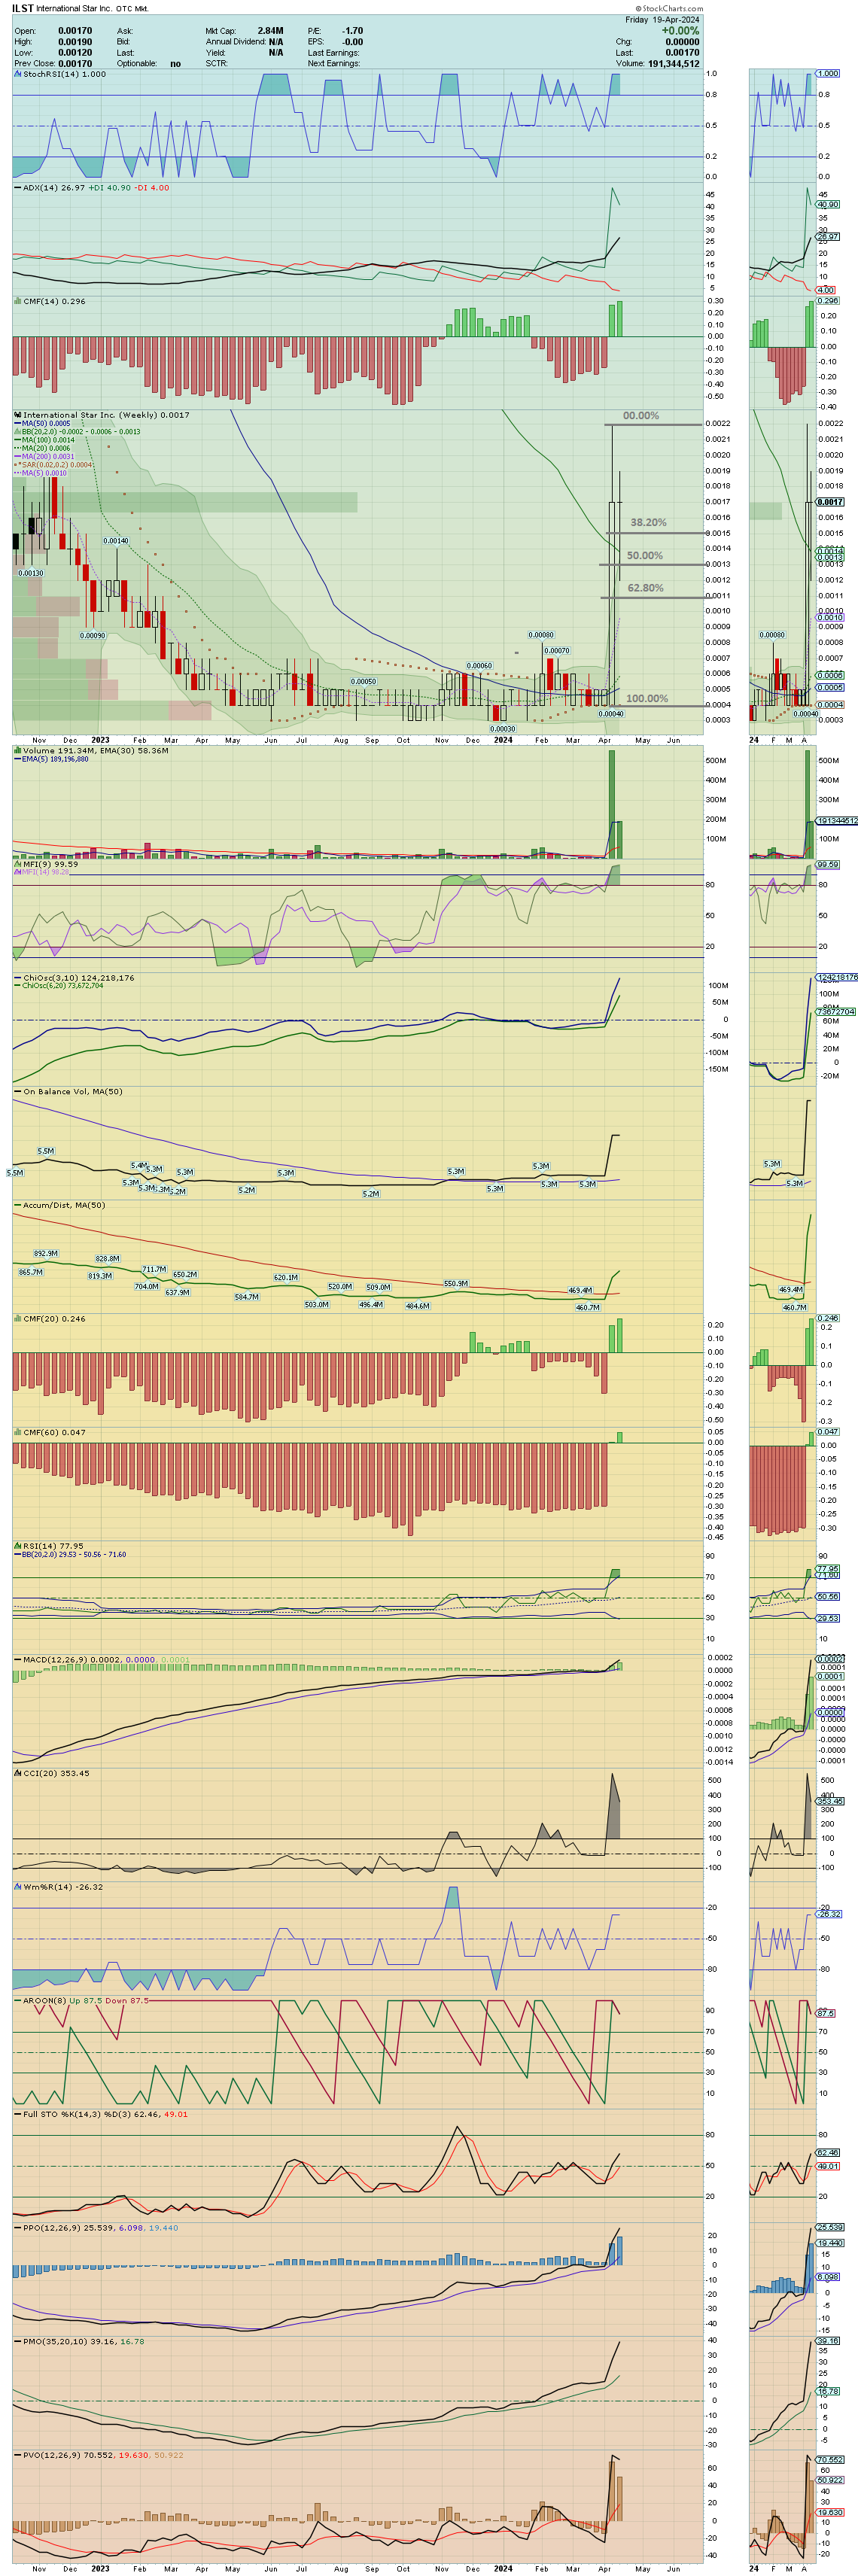
ILST chart~~~ Projection for next week: Bullish Piercing Pattern and the usual recognizable Flag Continuation Pattern for our OTC Golfers.
* A brief on chart Indicators
https://investorshub.advfn.com/boards/read_msg.aspx?message_id=146368673
chart & TA post thread
https://thepatternsite.com/Piercing.html
https://thepatternsite.com/htf.html
https://school.stockcharts.com/doku.php?id=chart_analysis:chart_patterns:flag_pennant_continuation
https://stockcharts.com/h-sc/ui?s=ILST&p=D&yr=0&mn=5&dy=10&id=p24986097784&listNum=23&a=1113701411
Trding; glad to see you posting live charts. I lost over 1000 posted charts from 2006 when IHUB restricted live Stockcharts 
I do not currently subscribe to Stockcharts but they save all my old charts because a lot of posters use them and Stockcharts uses them to 'click bate' IHUB viewers.
~~~ As a moderator I will add your live chart to the IBOX! I will be working on more IBOX candy over the weekend.
Yeah, I think I will revisit Da Burbs... last time I thought IHUB would close the board because of the Zoot Suit Riot with a crowd of Bashers.. 
I am finding out that the 2hr. chart is like a crystal ball and better & more informative then the daily when it come to prediction.
ILST 2hr chart~~~ Better view of Accumulation & Volume Money Flow. There is a .0005 gap, we can use it as a bone to throw out in the yard to distract our yapping Dog Basher.....
.https://stockcharts.com/h-sc/ui?s=ILST&p=120&yr=0&mn=1&dy=10&id=p24986097784&listNum=23&a=1113701411
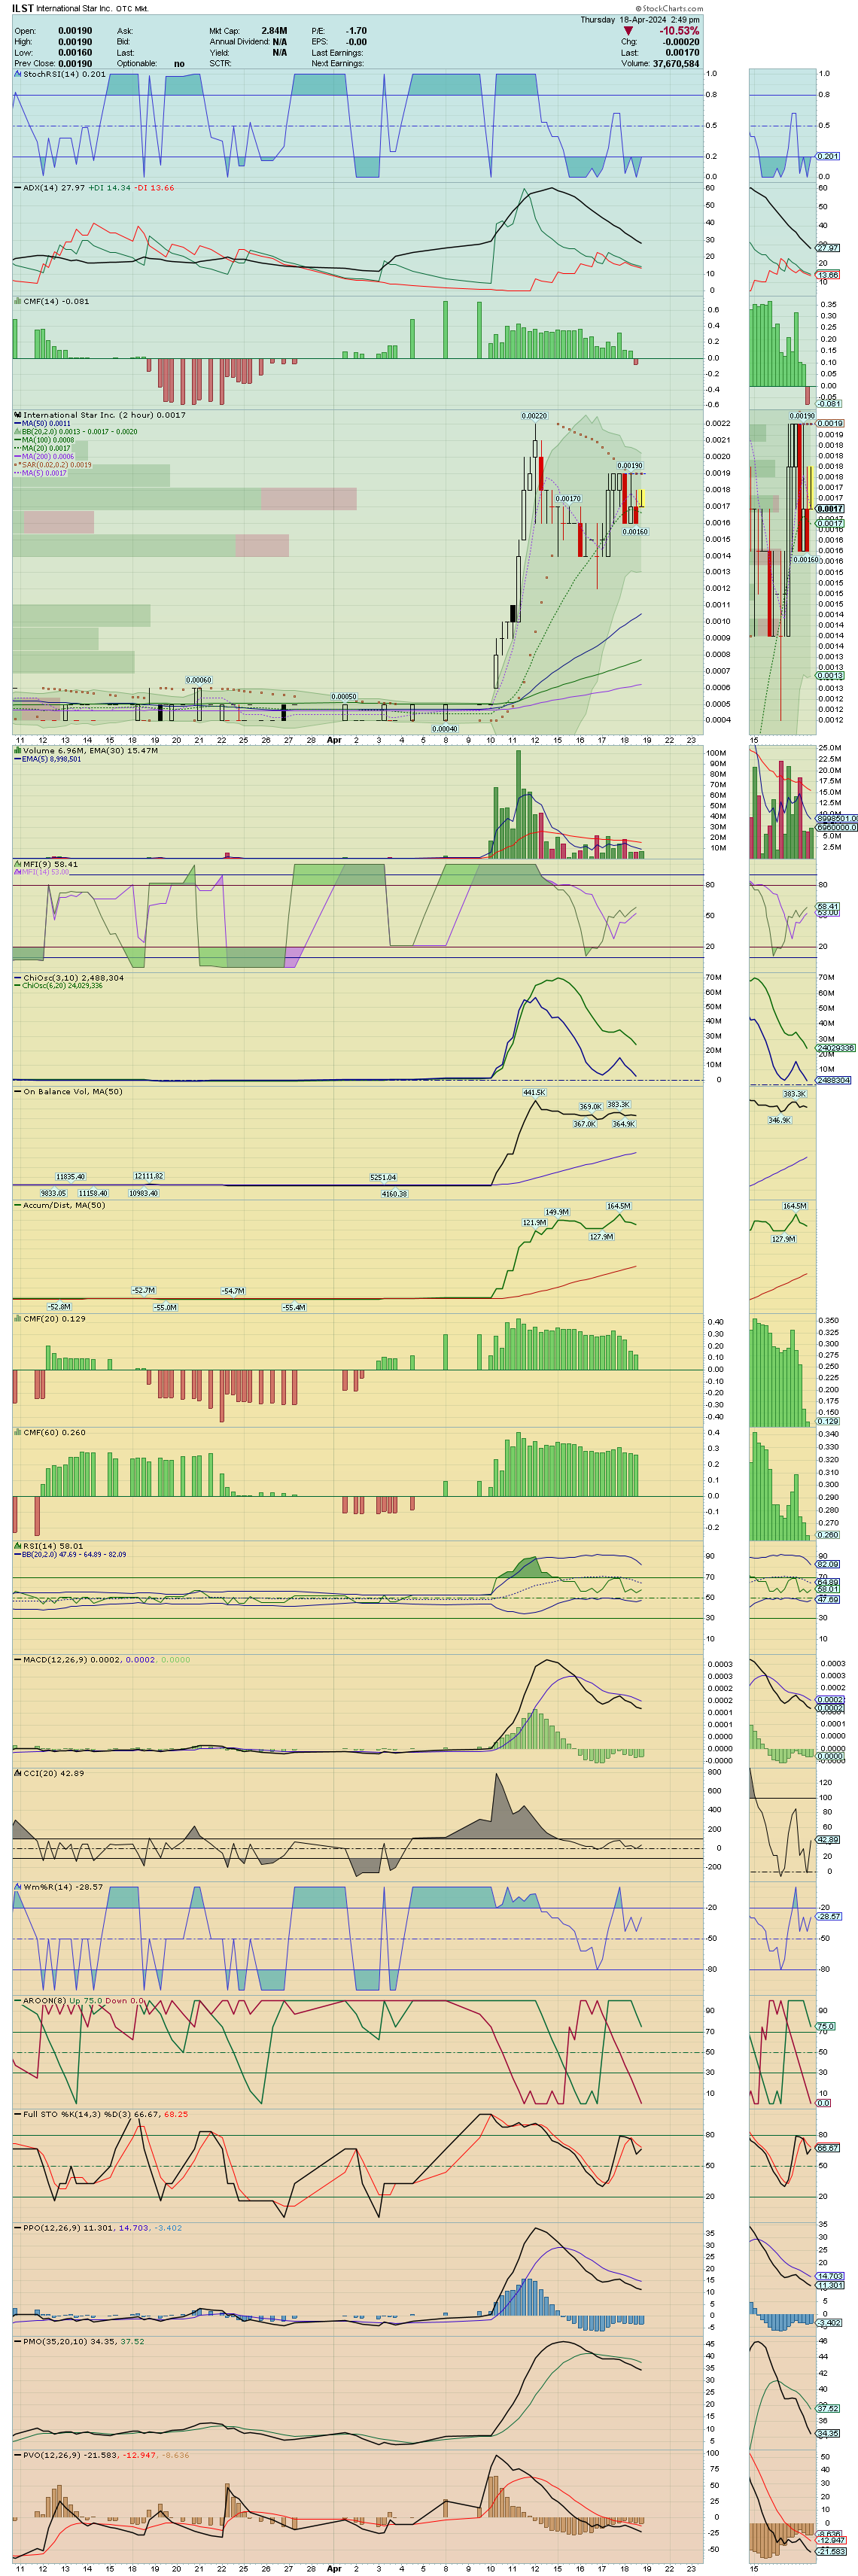
ILST intraday~~~ We flushed out the Profit Takers on Tuesday. Now into flag consolidation and the normal ask stacking with futile attempts to prod more sellers....
* Notice on the daily chart no PPS erosion with higher lows. Now all we have is .0019 overhead resistance to focus our energy on.
chart & TA post thread
VWAP chart refresher. EMA(30) for 21/2 hours, EMA(79) is all day and VWAP resets each day
https://school.stockcharts.com/doku.php?id=technical_indicators:vwap_intraday
https://stockcharts.com/c-sc/sc?s=ILST&p=5&yr=0&mn=0&dy=2&id=p69741074503&a=1100650802&listNum=23
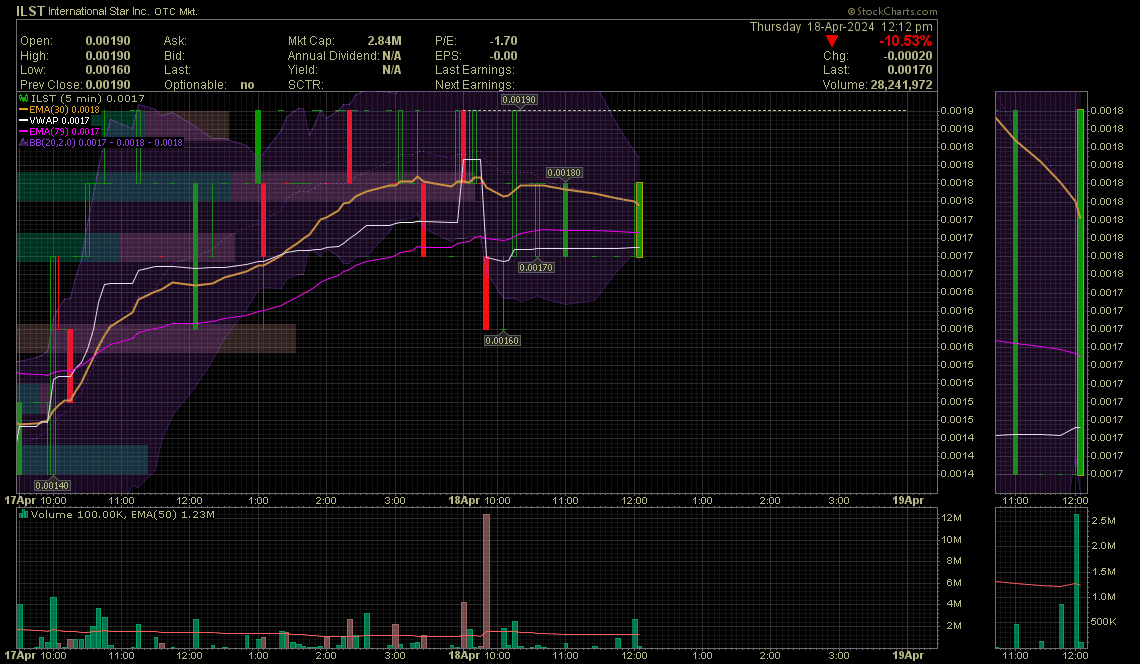
https://stockcharts.com/h-sc/ui?s=ILST&p=D&yr=0&mn=3&dy=0&i=p8114168745c&a=635806730&r=1544761759229

Compound Chart
#1. AROON- 8 You watch as the AROON DOWN crosses the 75 down and the AROON UP comes up from zero. Most important. (\0/)
#2. WILLIAMS%R- 9 You watch the line cross the 50.
#3. CMF- 15 You will usually only see growth when the CMF is in the negative.
#4. ADX/DMI-5 You watch as the D+ line either crosses the D-, or crosses above the 20.
#5. MACD histogram- 5,15,10 You watch the negative bars register -50% smaller then the bar before it, or -50% smaller then the largest in the grouping.
#6. Full Stoch- 5,3 You watch the fast line cross the slow line while the AROON DOWN(8) crosses the 87.50. Crossing the 20 would be best, when the Williams agrees. The full stoch crossing the 50 usually starts off the AROON UP for crossover into growth dominance.
#7. Bollinger Band 20,2 You watch for the Magic Box to occur when the negative close touches above the lower bolly and the next day’s close to it is positive growth in a white candle.
#8. RSI 5 you watch as the indicator crosses above the 50 for a quick pop.
#9. MA(2) Watch the 2 day MA cross above the 5 day MA. That’s helpful.
#10. To sell it just watch the 2 day MA kiss the bottom center of the candle body where the shadowed low comes out, to buy watch it kiss the top center of the candle body where the shadowed high occurs.
Great to be here.
Reloaded this morning.
Geezer factor kicking in, limited to playing miniature golf with Grandkids and having more fun doing it.
ILST chart~~~ May make a birdie on this.flag.
I took a position on Friday because I liked the condition of the green and the players involved.
https://investorshub.advfn.com/boards/read_msg.aspx?message_id=146368673
https://thepatternsite.com/VerticalRunUp.html
https://thepatternsite.com/htf.html
https://school.stockcharts.com/doku.php?id=chart_analysis:chart_patterns:flag_pennant_continuation
https://stockcharts.com/h-sc/ui?s=ILST&p=D&yr=0&mn=5&dy=10&id=p24986097784&listNum=23&a=1113701411

EMGE compound chart
Compound Chart
#1. AROON- 8 You watch as the AROON DOWN crosses the 75 down and the AROON UP comes up from zero. Most important. (\0/)
#2. WILLIAMS%R- 9 You watch the line cross the 50.
#3. CMF- 15 You will usually only see growth when the CMF is in the negative.
#4. ADX/DMI-5 You watch as the D+ line either crosses the D-, or crosses above the 20.
#5. MACD histogram- 5,15,10 You watch the negative bars register -50% smaller then the bar before it, or -50% smaller then the largest in the grouping.
#6. Full Stoch- 5,3 You watch the fast line cross the slow line while the AROON DOWN(8) crosses the 87.50. Crossing the 20 would be best, when the Williams agrees.
#7. Bollinger Band 20,2 You watch for the Magic Box to occur when the negative close touches above the lower bolly and the next day’s close to it is positive growth in a white candle.
#8. RSI 5 you watch as the indicator crosses above the 50 for a quick pop.
#9. MA(2) Watch the 2 day MA cross above the 5 day MA. That’s helpful.
#10. MA(2) To sell it just watch the 2 day MA kiss the bottom center of the red candle body.
https://stockcharts.com/h-sc/ui?s=EMGE&p=D&yr=0&mn=3&dy=0&i=p8114168745c&a=635806730&r=1544761759229

THE MAGIC BOX
(A) The Magic Box is a pure two-day pattern. Basically the "close" of a red candle printing on or near lower Bollinger Band with the next day printing an "open white candle."
A gift from The Seasonality Stock Reports Board
The reason that I named this setup the Magic Box was so that you could relate to it and remember it faster. Without relationship to something, it is nothing to us. It must be something memorable to you before you can set it into your subconscious mind and see it always.
(A1) On day one the Aroon Down is setting at 100 on the indicator and price is near the lower Bollinger Band. The Candlestick is dark-shadowed.
(A2) On day two, to form the Magic Box, the Aroon Down must drop to 87.50, and price to form a white candle, to complete the box. No other indicator is watched until this occurs for this setup, just the Bollinger Band and the Aroon Down.
If you see a Magic Box develop, that being, on the first day the Aroon Down going from 100.00 while the close is either on or just above the lower Bollinger Band and the second day the Aroon Down is now 87.50, you have a Magic Box.
(B) The buy opportunity occurs when the confirmation of two things happens: on day three or few days later the Aroon Down goes to 75.00 and the Williams%R comes above the -50%. That is the buy. The Williams must come through the -50%. It may take more than three days but you must wait for the confirmation of the William%R. I have seen again and again, the Aroon Down come down from 100.00 to zero without the Williams ever crossing the -50%, those are the ones you pass on. There will be no growth when this happens. At most there is consolidation or a small drop. During this process the Aroon Up can rise slowly but without the Williams you have nothing.
There are other Magic Boxes that develop in a stock's life cycle, too, and they, too, can give great growth. These are the supported median, the floating, and the rising Magic Boxes. The buy-in criteria, though, will remain the same for all of them. The Aroon Down comes to the 75.00 and the Williams crosses the -50%. June 7th, 8th, and 9th accomplish this in the 2007 HGR chart, though the William%R took until June 13th to confirm. You must wait.
Trading: It is highly recommended that you paper trade the system to familiarize yourself with it thoroughly. As with anything in life nothing is guaranteed, so, always use appropriate stop loss according to your risk tolerance.
Kenneth J. Goodrich
http://investorshub.advfn.com/SEASONALITY-STOCK-REPORTS-1616/
Example
http://investorshub.advfn.com/boards/read_msg.aspx?message_id=37119243
Sell trigger
https://investorshub.advfn.com/boards/replies.aspx?msg=40130527
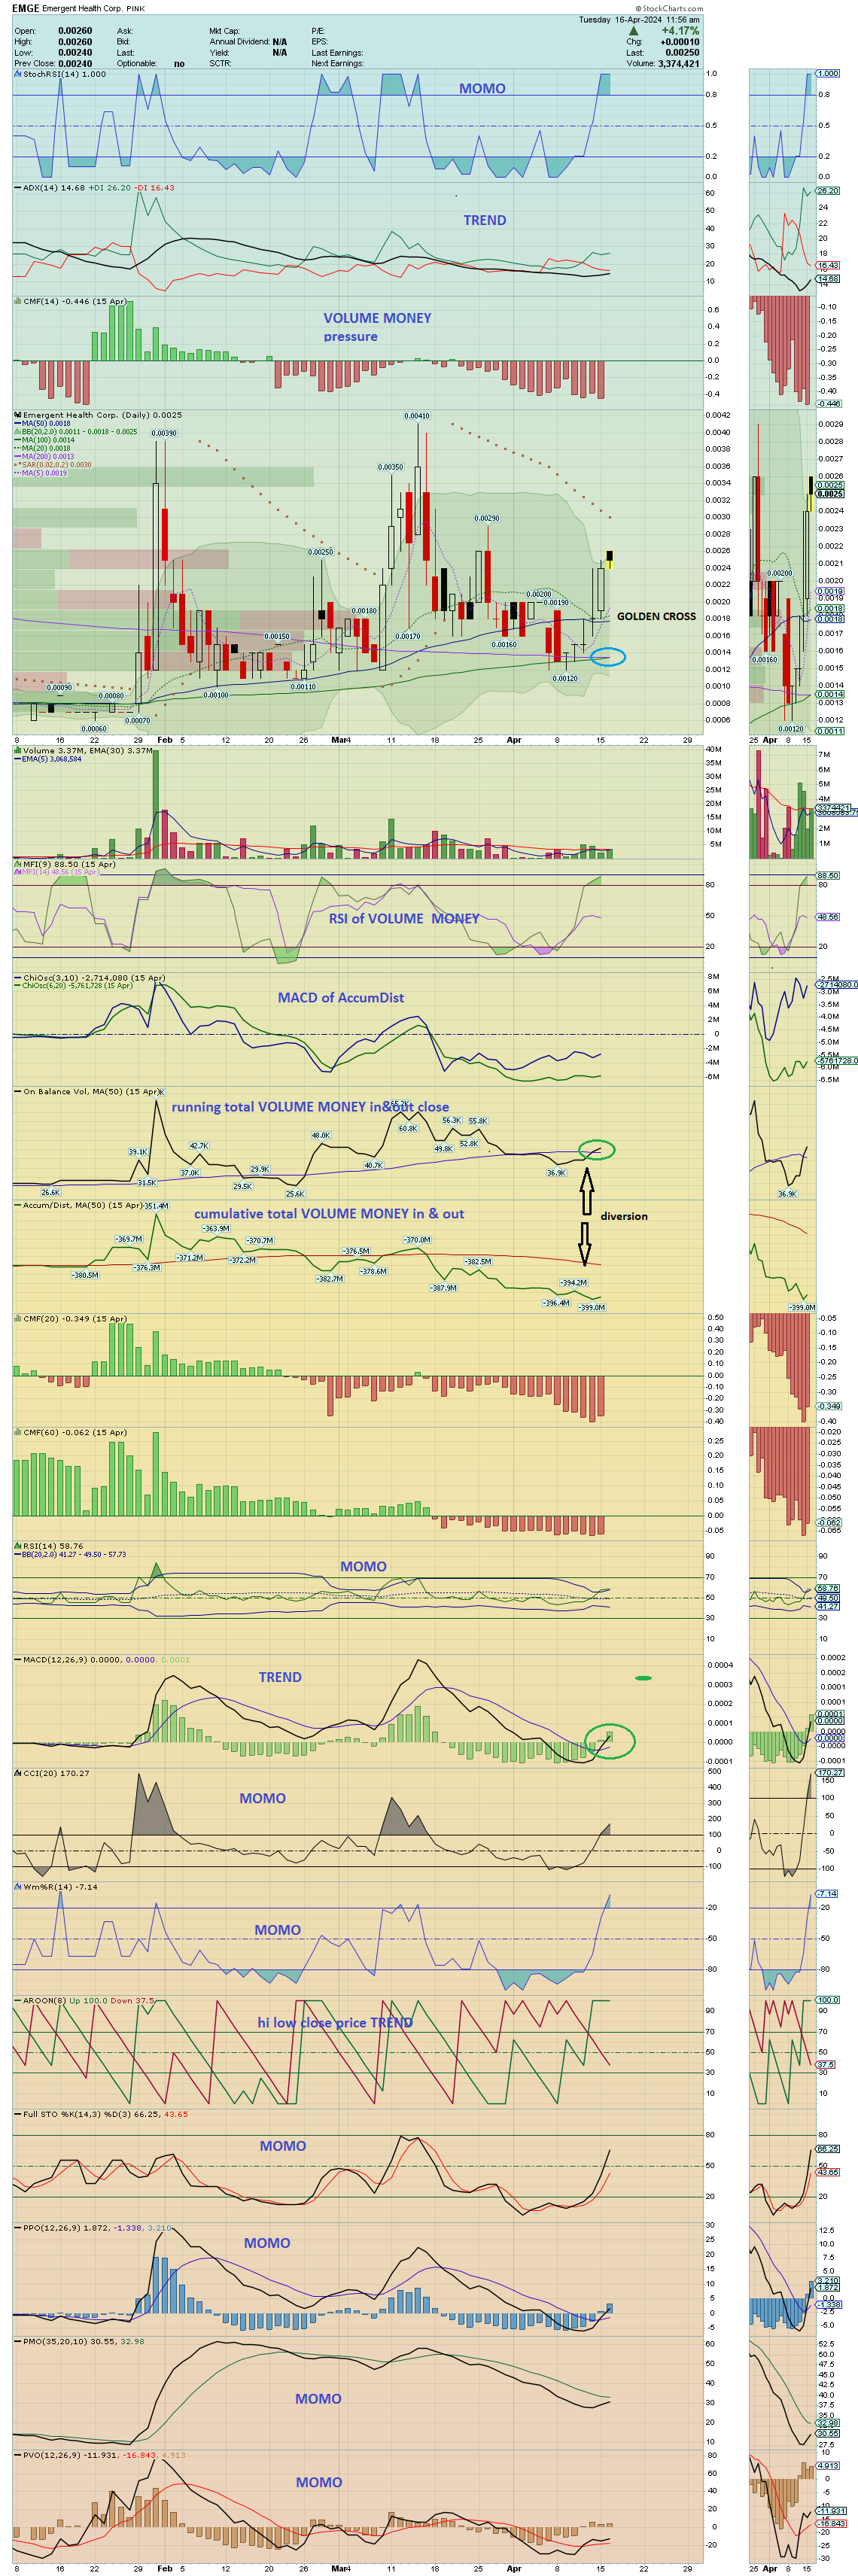
EMGE chart~~~ Breakout upward continuation pattern: MACD reset, six new price lines, Golden Cross and OBV diverting up from AccumDist.
All I can say is move target and volatility stops higher because profit taking is being outpaced by buyers. You cannot ask for any better leverage as buyer.
~~~ I did take a position on Friday so I am a very interested observer.
* A brief on chart Indicators
https://investorshub.advfn.com/boards/read_msg.aspx?message_id=146368673
chart & TA post thread
https://thepatternsite.com/8NewPriceLines.html
https://thepatternsite.com/aadt.html
https://school.stockcharts.com/doku.php?id=chart_analysis:chart_patterns:double_top_reversal
* OBV diverting up showing large players moving into float: a share today costs more than yesterday indicating float is tight (non dilution).
https://stockcharts.com/h-sc/ui?s=EMGE&p=D&yr=0&mn=3&dy=10&id=p24986097784&listNum=23&a=1113701411
Chuck; Agree, also the AI Accounts Receivable platform up-grade plus New Hires will be dragging Q1 profits down. There was no 'subsequent events' section in the Annual Report so Melvin has a lot to say in the upcoming shareholder letter.
Melvin always posts Shareholder Letter 5-10 days after Q's or K.
Probably the sudden interest of German Investors causing a rewrite of the 'subsequent events' section of the Annual Report? The game is afoot!
Russell Reconstitution rank day is in May 24. In the subsequent riot GDVM may pick up a Micro cap Hedge Fund or two if revenue/earnings pop up.
https://www.lseg.com/en/ftse-russell/russell-reconstitution
https://www.investopedia.com/terms/r/reconstitution.asp
GDVM fits into this investment category.
https://www.lseg.com/en/insights/ftse-russell/digital-assets-correlation-revisited
I know what you mean, example: "crowd funding". The stock is ZNOG...I moderated the board once, surprised they still have my IBOX posted.
Missed all the chart GDVM works. Sorry, I was at Darien Lakes State Park in NY at dead center of the totality path. I cannot find the words to express my feelings about this experience of witnessing this event.
Wingtrade; I agree, over the years Traders have called the small fills between bid and ask "hidden asks". If too many traders start the practice with $50 it gets too crowded and the PPS gets bumped up accidently and attracts a wild eyed seller to a minor high spike. Me and Govprs bumped heads on a buy a few weeks back and dropped the PPS 7%... so it can go either way depending on the size of the ask overhang and if other buyers want to chase it.
I do not know about other Fidelity accounts. I have been trading from the IRA account since 1972 and do not remember commissions.
Zero commissions with Fidelity trading on my Rollover IRA account. I wanted to see if I could shake things up with a $50 slap at limit .023 but the MMs filled me for $46.75. at price 0.02125.
Well, buy trade #2 for 2,200 was mine just now... at lest no PPS erosion like #1 was. So it looks like me and #1 are in Hell together until April 15.
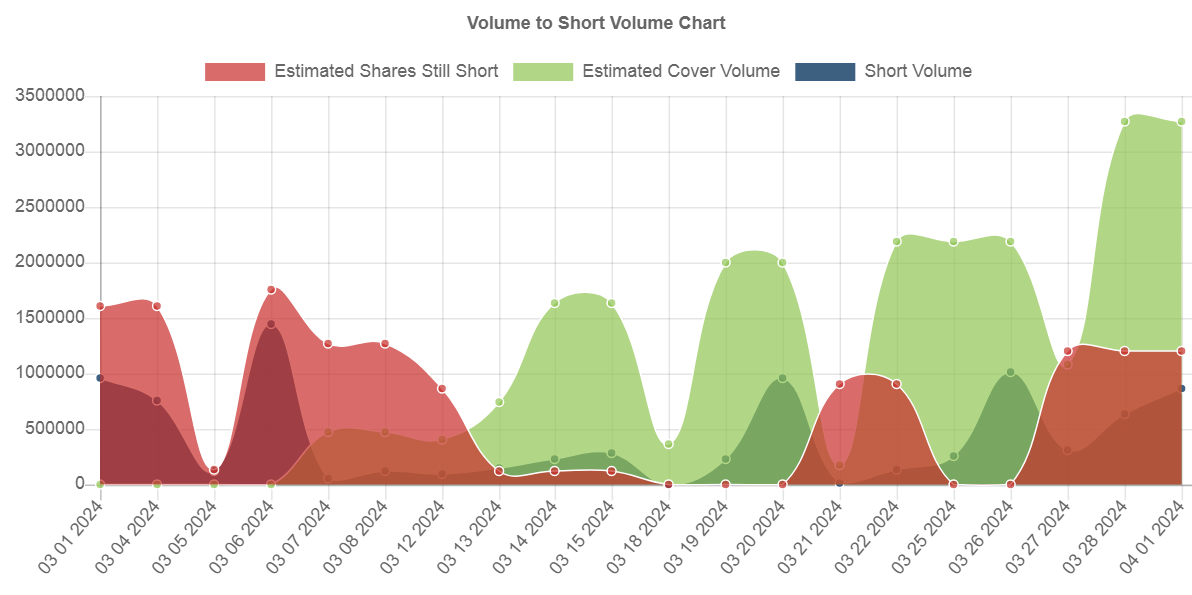
GDVM short chart~~~ To give us measure for for any explosives in the storage magazine .... like in 7 days to bleed off cover volume tells us how long a breakout run may last on our low daily trading volume.
* Fee rate 22% so it is only the MM's participating, not OTC Retail.
https://www.iborrowdesk.com/report/GDVM
* Cover volume in the MM storage cabinet primed for our run up.
https://marketwirenews.com/stock/gdvm/short/
Yeah, buy trade was split with a buy/sell (# 11 & 12)..... yep, back to normal.
I added this morning because I have a hunch all the sellers were flushed out yesterday so all this week there will be normal accumulation.
LOL, Richard; Your TA source is questionable.
* A "weak 8% sell recommendation" and only with PPS .0220 down -19% !!!???
https://www.barchart.com/stocks/quotes/GDVM/opinion
* Compared to this 'smash and grab'.... the most popular P&D in the OTC universe.
https://www.barchart.com/stocks/quotes/GVSI/opinion
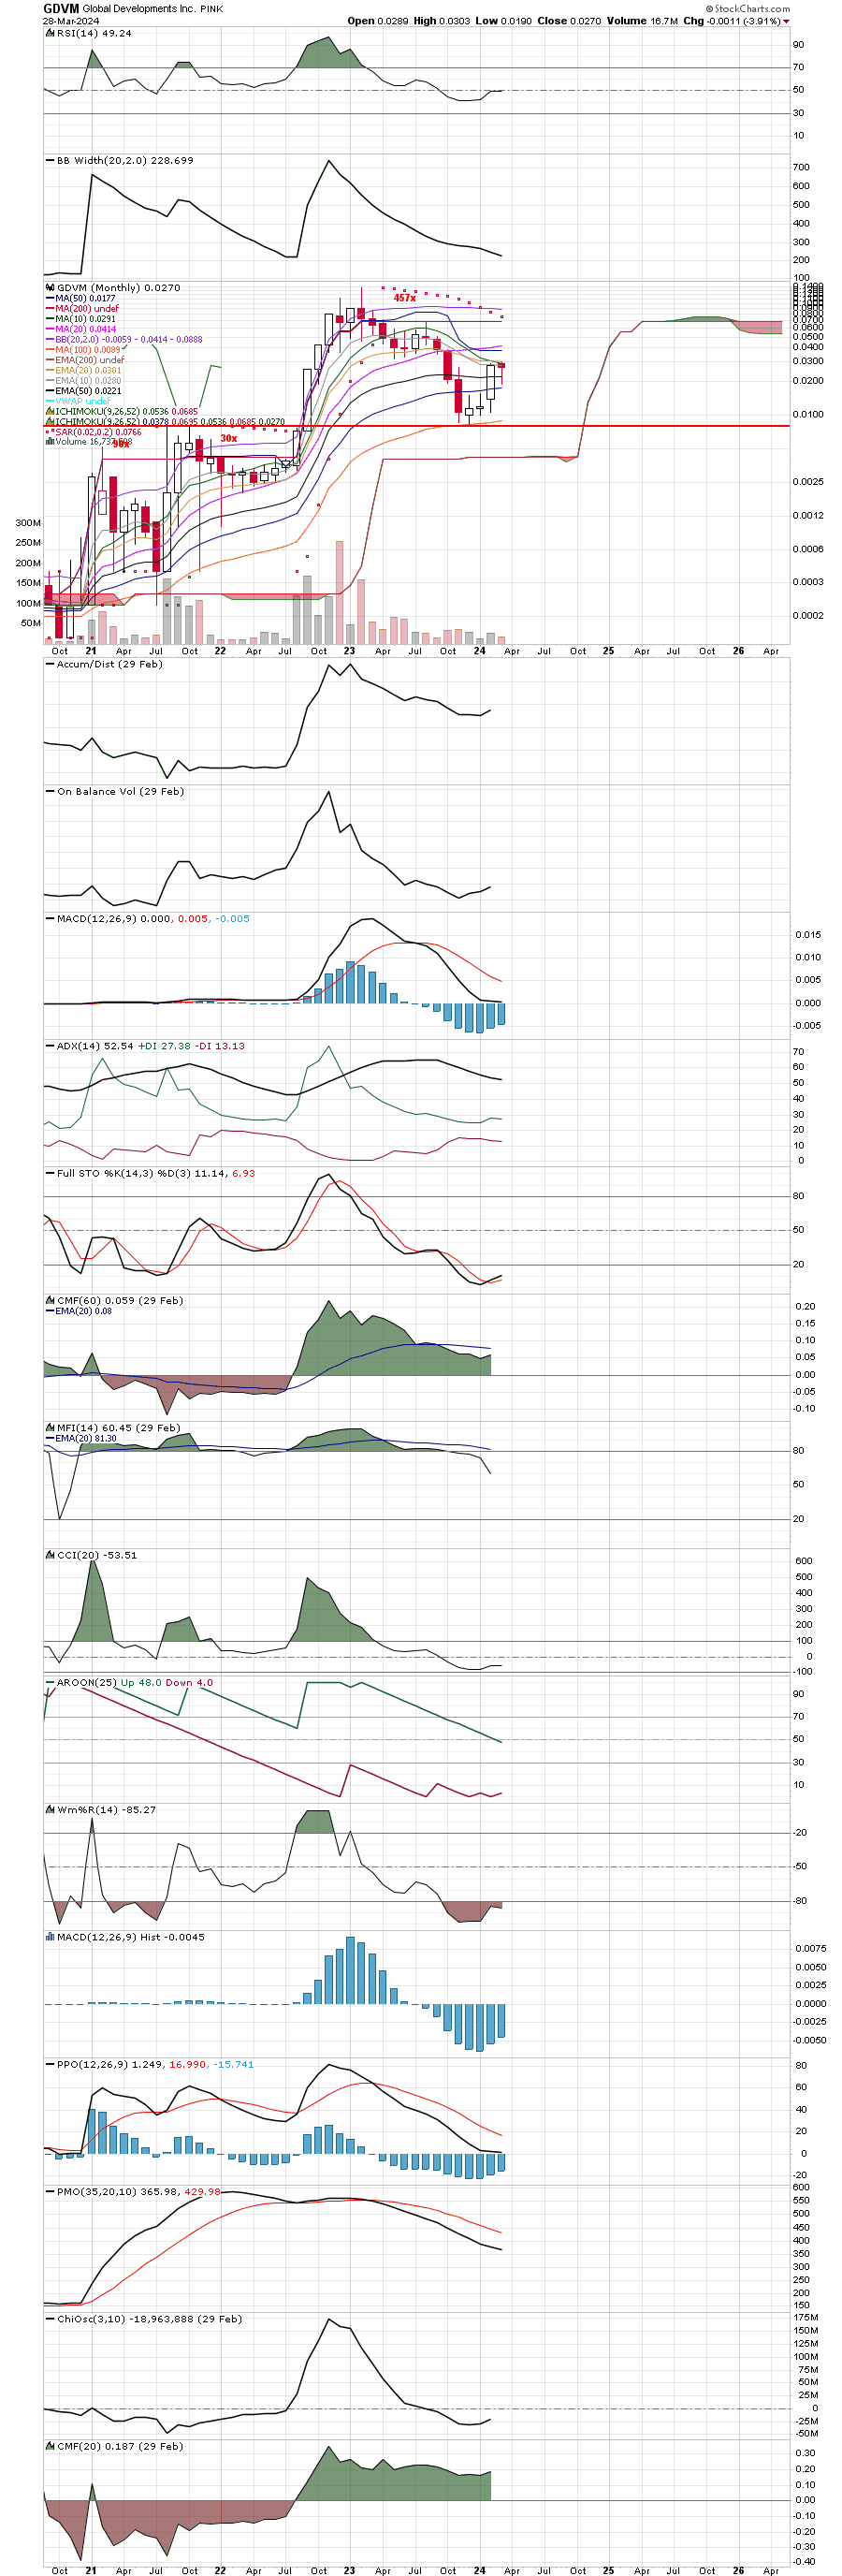
GDVM weekly chart~~~ Notification of Late Filing is not the greatest catalyst to kick off the week. We (the Greybeard Longs) expected a late filing anyway because we do have a good read on Melvin over the years.
https://www.otcmarkets.com/otcapi/company/financial-report/396053/content
* A brief on chart Indicators
https://investorshub.advfn.com/boards/read_msg.aspx?message_id=146368673
chart & TA post thread
* This was a 4 session week and I am surprised with the good showing of volume.
https://stockcharts.com/h-sc/ui?s=GDVM&p=W&yr=0&mn=11&dy=30&id=p85023291209
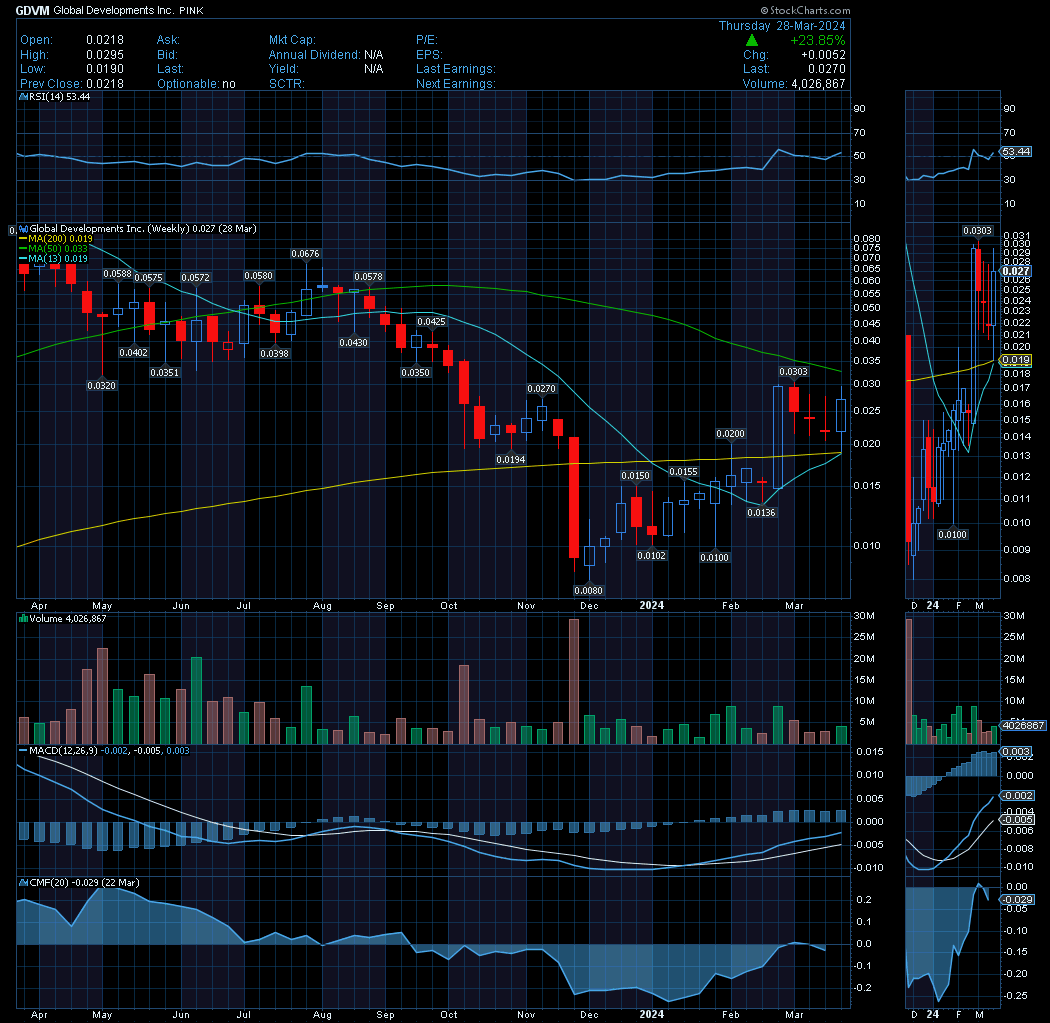
* The cup handle is filling out nicely confirming our continuation pattern(s). Say a tight flag running into April, 15 unless Melvin pulls a fast one giving us a gap up.
https://thepatternsite.com/flags.html
https://school.stockcharts.com/doku.php?id=chart_analysis:chart_patterns:flag_pennant_continuation
https://thepatternsite.com/cup.html
https://school.stockcharts.com/doku.php?id=chart_analysis:chart_patterns:cup_with_handle_continuatio
https://stockcharts.com/h-sc/ui?s=GDVM&p=W&yr=1&mn=6&dy=0&id=p24986097784&listNum=23&a=1113701411

Stocksbelow1; For entertainment reasons GDVM is a fun stock, low risk and very predictable. Where else in the OTC you can have -22% as a minor low for the day and still close green with no apparent PPS erosion closing up 24% in a 4 session week.
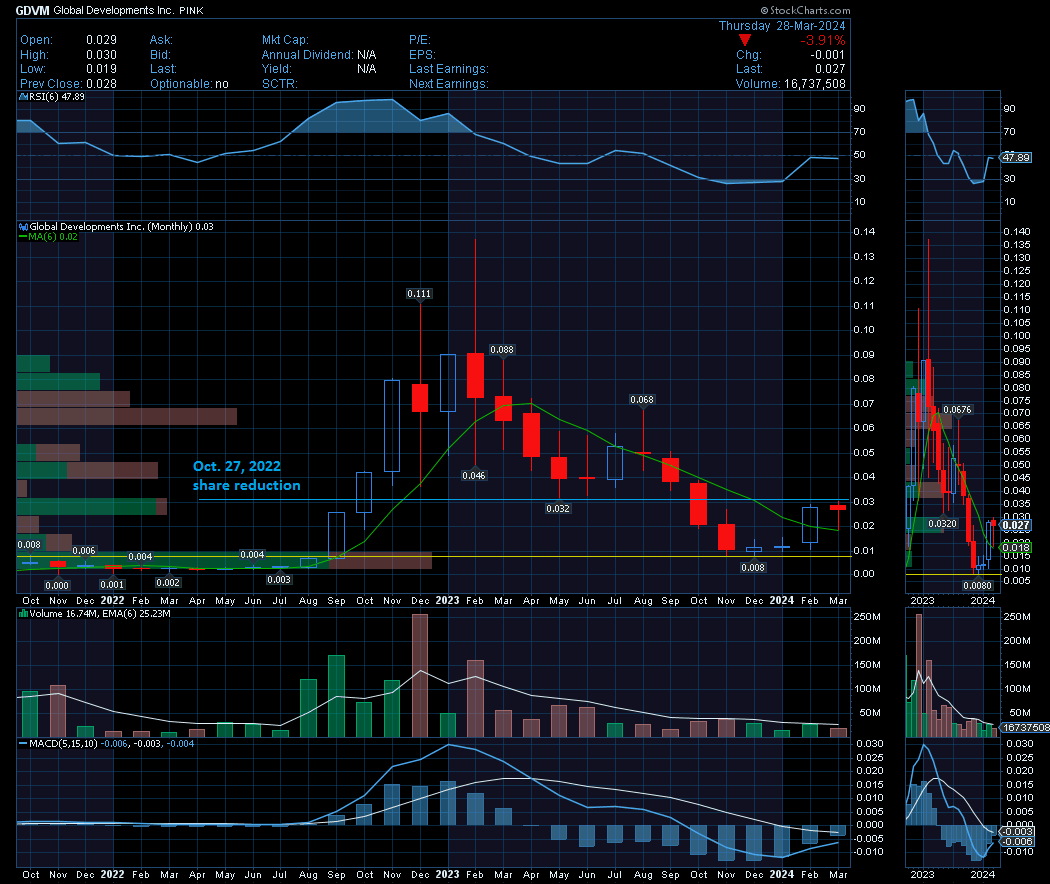
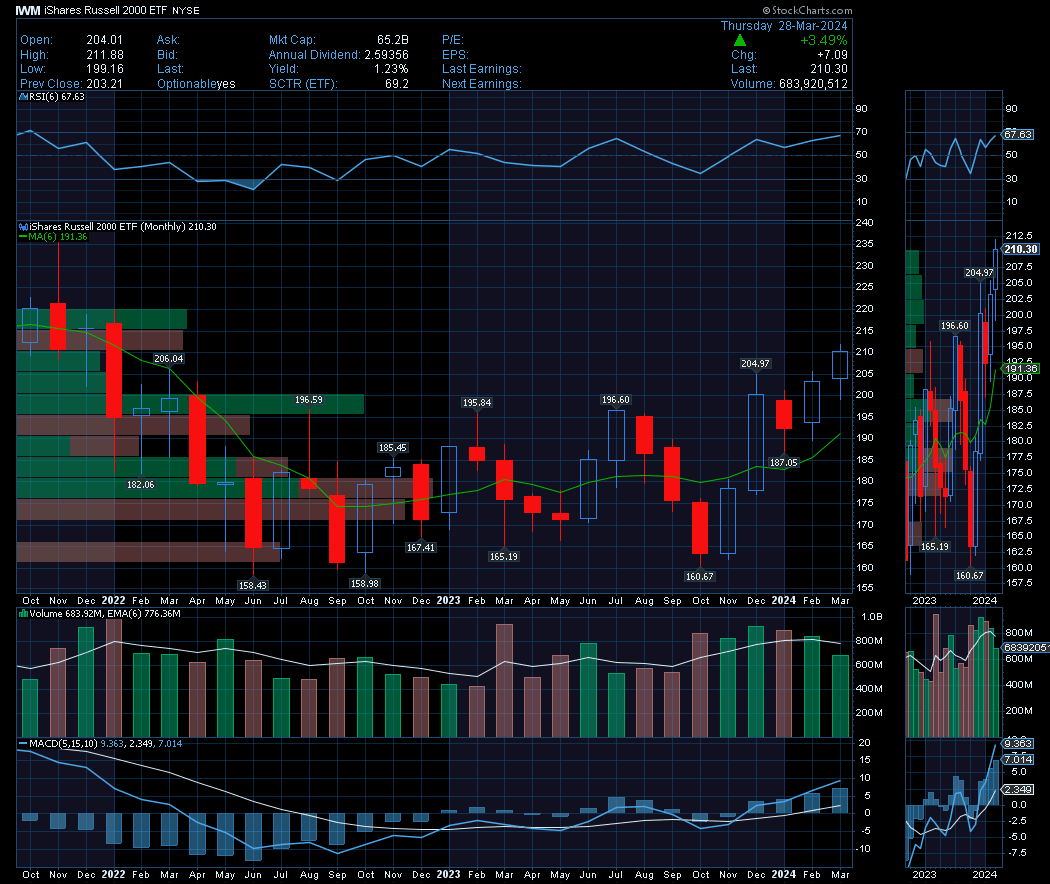
GDVM monthly~~~ Reflecting similar pattern as the Russell.2000.
chart & TA post thread
* 2.6yr monthly GDVM and Russell 2000~~~ There really is a matching higher exchange trickle down especially after GDVM started behaving normally after the share reduction, even surviving the recovery(trauma?) from the February 2023 speculative run up.
https://stockcharts.com/h-sc/ui?s=GDVM&p=M&yr=2&mn=6&dy=0&id=p33640583369&a=1113701411
https://stockcharts.com/h-sc/ui?s=IWM&p=M&yr=2&mn=6&dy=0&id=p33640583369&a=1113701411
* Dolphintom's 3yr monthly with three consolidation periods. We just finished a four month consolidation with a $0.0080 December retracement low.
https://stockcharts.com/c-sc/sc?s=GDVM&p=M&yr=3&mn=6&dy=10&id=p99448199858&a=1474492466&listNum=1
Agree, the more we know about it the more the angler momentum of thought changes.
* When the GDVM annual report will be released is an excellent thought exercise utilizing Schrödinger's Cat and Heisenberg's Uncertainty Principle.
GDVM chart~~~Thursday before annual report, curious to see if leap year makes a difference.
The cup and the handle are written with low volume so don't expect expect an esthetic "classic" picture. We have so many Long Traders (Investors?) wrapping up the float that no one even thinks about selling on minor -10% lows.
* A brief on chart Indicators
https://investorshub.advfn.com/boards/read_msg.aspx?message_id=146368673
chart & TA post thread
https://thepatternsite.com/cup.html
https://school.stockcharts.com/doku.php?id=chart_analysis:chart_patterns:cup_with_handle_continuatio
https://stockcharts.com/h-sc/ui?s=GDVM&p=D&yr=0&mn=5&dy=10&id=p24986097784&listNum=23&a=1113701411
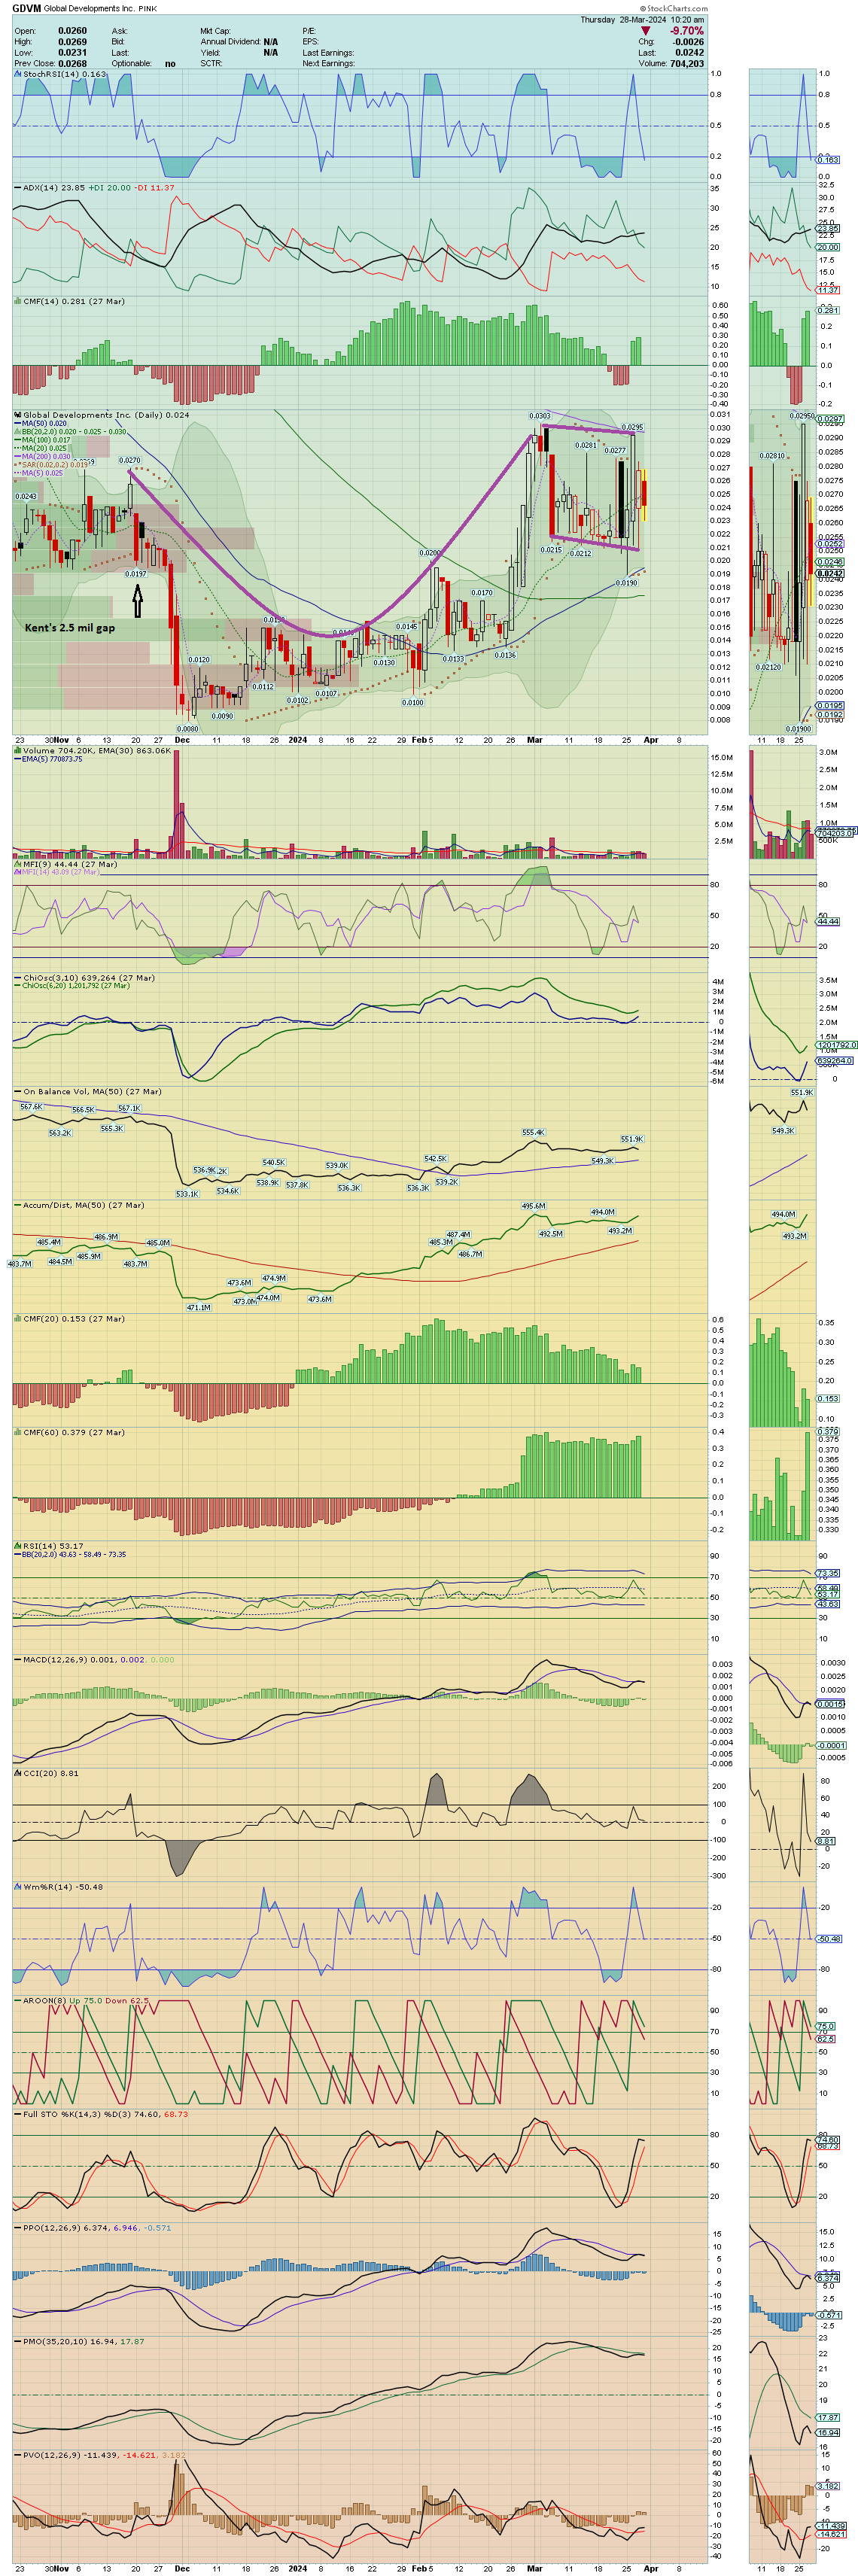
SEC filing calendar has April, 1 the latest. This is our accumulation week.
https://edgarsolutions.com/resources/sec-filing-calendar/
ABQQ chart~~~ Ice Trader; Investor Sentiment seems to like the CEO's Business Plan. There is serious accumulation taking place between the minor highs & lows of the 3 week side channel. Yeah, today, with 3:1 buy/sell ratio maybe we can scratch out a GREEN FRIDAY!
* A brief on chart Indicators
https://investorshub.advfn.com/boards/read_msg.aspx?message_id=146368673
chart & TA post thread
* PSAR is also a shorting tool~~~ Social Media Influencers make appearances on stock message boards push PPS back down.
https://school.stockcharts.com/doku.php?id=technical_indicators:parabolic_sar
https://stockcharts.com/h-sc/ui?s=abqq&p=D&yr=0&mn=3&dy=10&id=p24986097784&listNum=23&a=1113701411

Russell, OTCM, OTC index charts & GDVM chart~~~ Money supply is driving the markets, interest rates are being held at present rate.
* It looks like OTCM is an leading indicator by one month.
https://stockcharts.com/h-sc/ui?s=IWM&p=D&yr=1&mn=0&dy=0&id=p79120427915

https://stockcharts.com/h-sc/ui?s=IWV&p=D&yr=1&mn=0&dy=0&id=p79120427915

https://stockcharts.com/h-sc/ui?s=OTCM&p=D&yr=1&mn=0&dy=0&id=p79120427915

https://stockcharts.com/h-sc/ui?s=%24DYO&p=D&yr=1&mn=0&dy=0&id=p79120427915

https://stockcharts.com/h-sc/ui?s=GDVM&p=D&yr=1&mn=0&dy=0&id=p79120427915
ABQQ chart~~~ Bullish continuation setup, a sudden volume surge and lack of sellers is a signal for a ........
* A brief on chart Indicators
https://investorshub.advfn.com/boards/read_msg.aspx?message_id=146368673
chart & TA post thread
* A three week side trap, I think all our big sellers are gone so it looks like we own this turkey. Imminent breakout from this continuation pattern with the volume "U" supported by right & left green bars holding up our inverted arch. We are in the consolidation looking for a breakdown candle followed by a reversal candle.
https://thepatternsite.com/rectbots.html
https://school.stockcharts.com/doku.php?id=chart_analysis:chart_patterns:rectangle_continuation
https://stockcharts.com/h-sc/ui?s=abqq&p=D&yr=0&mn=3&dy=10&id=p24986097784&listNum=23&a=1113701411

SIDE TRAP CHART PATTERN
http://www.tradewithme.me/trading-systems-v--swing-trading.html

This is only a summary.
How to Trade It : There are three components to trading this chart pattern:
consolidation
breakdown
reversal
You need a sideways consolidation, then a breakdown causing the chart to look bearish, and finally a reversal pattern. This is why this pattern is called a "side trap". The stock trades sideways and then traps traders who shorted the breakdown.
The Entry You want to establish a position with this stock on the day of the reversal candle. But, you do not want to trade just any reversal candle. You want the candle to be strong one. Make sure it closes at least halfway into the range of the breakdown candle. This will show up as a piercing candlestick pattern or a bullish engulfing candlestick pattern (see the examples above).
Taking Profits Nothing special here. Just trail your stops using your favorite exit strategy. However, when the stock market offers you a gift - take it! If the stock explodes, and goes up 15% in a couple of days, at least take partial profits and trail your stops on the rest.
Keep in mind that you are wanting to see this stock move above that sideways trading pattern (consolidation). That is where the explosiveness will kick in.

