 News
News  Market Data
  Discover
Support: 888-992-3836
Copyright © 2023 InvestorsHub Inc.


Register for free to join our community of investors and share your ideas. You will also get access to streaming quotes, interactive charts, trades, portfolio, live options flow and more tools.
EEENF tell me if you bought
Great site, anyone do well off these stocks
EEENF tell me if you bought
EEENF we hit oil, 0.00, don’t let the shares outstanding scare you, this can run quickly
$RDAR HOT - News Will Drop This Morning
$RDAR News Dropping in the AM https://t.co/IaGbhNFhvv
— 💸 Golden Cross Stocks 💸 (@CrossStocks) April 17, 2024
$RDAR Selling seems done ~ Partnership candidate could be announced any day!
$GSAC
🚨 $GSAC Next trip runner!
*1.2B float
*No dilution in recent months
*Added 1.2B shares to restricted 👀
- Catalysts:
*Talking about more announcements in the near future related to the acquisition
*upcoming annual report
*Expecting to establish a new research in south africa https://t.co/Z75TJ2uVDU pic.twitter.com/k8Yll9iocq
— NarutOTC (@NarutOTC_) April 11, 2024
INDR not many shares outstanding
INDR not many shares outstanding
$GSAC Remember this DD
— L𝗶KO (@Likko_G) April 12, 2024
Because once it will run
Don’t forget who brought you this.
Yesterday’s BID increased X3
While the ASK got thinner
Can get out of trips.. EASILY!! https://t.co/SJNhx6JObI
New directors 400 million accumulation
undervalued overlooked until its not
$GSAC #newdirectors #Update pic.twitter.com/NyEYyzVMdL
— Johnny President (@zarproductions1) February 27, 2024
$PDGO! news tomorrow .
The company will be updating shareholders tomorrow morning. $PDGO#shareholders #OTCMarkets #PDGO #StockMarket pic.twitter.com/dQtG9cxibA
— Paradigm Oil and Gas, Inc. (@PDGOinc) April 8, 2024
New directors 400 million accumulation
undervalued overlooked until its not
$GSAC #newdirectors #Update pic.twitter.com/NyEYyzVMdL
— Johnny President (@zarproductions1) February 27, 2024
EEENF millions in the bank , debt free, have a producing property and on another property hit oil
$RDAR .0002/.0003 No RS per the company last week! Looking for quick double from here!
$RDAR we have concerns from shareholders about a RS … There will be no plans for a RS and also we will be addressing the share structure soon. Our goal is to grow the company and increase shareholder value. Stay tuned for more company updates.
— RAADR.com (@raadr_) March 21, 2024
Hi t 53 in the examples of return to trading you showed, you didn't mention that generally a decommissioned stock comes back to life after about two years. For wcvc we are already beyond this time limit. In the other examples, too, the returned titles took about a year
Revoked and Re-registered stocks Trade Again
https://investorshub.advfn.com/boards/read_msg.aspx?message_id=174007357

JSHG Revoked then Re-registered and traded again
https://investorshub.advfn.com/boards/read_msg.aspx?message_id=174008053
$RDAR News next week per new company tweet today!
$RDAR thanks for your patience. We have great #news coming for you next week! We are excited to show you what we have been working on and are ready to implement. We believe these updates will greatly increase the use of our app and bring much value to our shareholders #Apps
— RAADR.com (@raadr_) April 4, 2024
EEENF can only go up from here
TGGI feel pennies with right news
When a new admin takes over....that is energy independent.
0.0001 and then the moon TGGI
0.0001 and then the moon TGGI
$TMSH The next .000 runner! Put it on your watchlist https://investorshub.advfn.com/boards/read_msg.aspx?message_id=174121841


I developed this Board for "Six" reasons
1.
I wanted to create a Board
where "traders" could visit, and find, "Trips" stocks.
2.
I wanted to give those of us who are "Visual Traders",
a means of viewing multiple stocks quickly.
I have arranged all of the stock charts on this Board,
in alphabetical order, so that all visitors, and regular followers,
can quickly locate a stock that they want to Buy, Hold, or Sell.
A picture is, as they say, worth a thousand words.
No other Board is set-up in this manner.
3.
I wanted to "Alert traders" ,
of stocks that are in the "Accumulation Stage" of a stocks cycle,
getting them in at the bottom,
where they'll find the least amount of risk.
4.
I wanted to "Alert traders" ,
of stocks that are at the top of their cycle,
getting them out,
before they enter into "The Correction Stage",
which begins the downturn,
and can erase most of the stocks gains,
of "Penny stocks" especially,
where a 50% to 200% haircut, is very common!
5.
I wanted to "Alert traders" of stocks to avoid,
that are in "The Correction Stage".
6.
I wanted to "Educate" the followers of this Board,
with helpful and informative trading strategies,
that will help them make money !
Trading Trip-Zero Penny Stocks
A trip-zero stock is a penny stock
which has a price that includes a decimal point,
followed by three - 'trip' - zeros,
and then a single digit.
Because the lowest share fraction tradable by a retail investor is .0001,
the lowest a stock can go is just the same,
0.0001 dollars.
So, a trip-zero stock can be anywhere from 0.0001 to 0.0009.
After that the stock no longer has three zeros,
and simply becomes a "sub-penny" or "subber".
Ok, now let's just try to comprehend what 0.0001 dollars really means.
It is one ten-thousandth of a dollar,
or... perhaps a little easier to grasp,
one one-hundreth of a penny.
Chop a penny into 100 little pieces,
and you can buy yourself one whole share of a 0.0001 stock with just one piece!
So you may be asking yourself,
"How the heck does a stock go this low?"
Well, the answer to that depends on the stock,
but generally it is due to dilution,
and the subsequent supply of shares outpacing the demand for them.
If nobody is willing to buy the stock, and the selling continues,
the stock goes down down down, all the way to 0.0001…
and then, when nobody is willing to buy,
not even at 0.0001, the bid disappears.
These are "no-bid" stocks,
and typically their asking price,
or offer, then becomes 0.0001.
It's all about the up-tick...
After hearing this story of dilution and never ending spiral to .0001 with no bid,
you may be totally writing off the trip-zero stock.
If you are looking for a safe investment,
then that is your best bet. Stay far, far away.
However, the lure and potential of these stocks
lies back with the basic stock market rule mentioned above.
If the lowest share fraction tradable by a retail investor is 0.0001,
then that is also the smallest price increase that a 0.0001 stock can have.
So if you buy the stock at 0.0001,
and the price goes up just one tick to 0.0002,
you've just doubled your money!
This is the potential, the leverage,
behind these trip-zero penny stocks.
Of course, as the price gets closer to 0.0009 that leverage decreases exponentially.
However, it still offers incredible percentages in gains.
Also, if a trip-zero stock starts running from .0008,
for example, it may go on to hit .0019 or more,
just as easily as a .0002 stock would go to .0004.
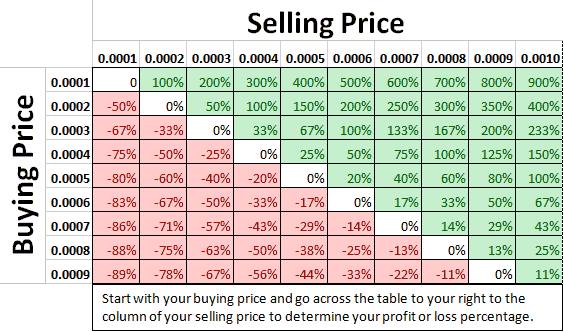
Now, Imagine if you were able to catch a real runner,
grabbed shares at 0.0001 and were able to sell them at 0.0010
That's a 900% profit, or a "10-Bagger".
Every so often it happens, and that is the golden lure behind these stocks.
Now, the fact that you cannot trade in between the ticks
is the reason these Trip-Zeros have this potential.
At the same time it makes it difficult to sell them
because you can't work in between the spread.
That is, you can't offer the shares you bought at 0.0001 for 'just under 0.0002'
and beat the other sellers to the punch.
You have to get in line at 0.0002, or 0.0003 and so-on,
and wait for your sell to execute.
With a stock that is running up to $0.01,
for example,
you could put in your sell at 0.0099
and beat those sellers lined up on the $0.01 ask.
Trip-Zero Profit/Loss Potential Chart
Selling is the hard part...
So you might be thinking,
"What's so hazardous about a .0001 stock?
It can't go any lower."
Well.. that's not really true.
First of all,
if the stock has no bid and you buy at the ask of .0001,
you've immediately assumed a 100% loss. Why?
Because, with no bid,
you couldn't even sell the stock readily if you wanted to.
Remember, you can't sell it for less than .0001.
So, to simply get out of your position even,
you'd have to put your sell in at .0001,
and hope your shares are bought up by someone else.
Now the issue with this is you are now at the very back of a long line of people trying to sell shares for .0001.
That's the way the market works.
Orders sent to a particular market maker get filled first come, first serve,
and if you're at the back of a long line,
you are going to be waiting until the last of the shares offered at .0001 - yours - are bought.
Once in a while you might get lucky
depending on what market maker your broker uses.
Say you use E*TRADE, which has its own Market Maker (ETMM),
and you are the only one trying to sell shares through ETMM at 0.0001
If a fellow Etrader comes along and decides to buy shares,
they will most likely match your orders
and you'll get filled before the line of people waiting behind NITE or AUTO.
Chances are, your market maker already has a bunch of orders queued,
but every now and then this might work to your advantage.
Beware of the Reverse Split
There is yet another way your .0001 investment could dwindle to oblivion.
If a company can no longer drive demand for their stock,
and cannot get it off the metaphorical .0001 "floor",
their only recourse is the dreaded Reverse Split.
A Reverse Split, or RS,
if you don't know already,
reduces the number of shares outstanding
while simultaneously raising the share price at the same ratio.
If they enacted a 100:1 RS,
and you had a million shares at .0001,
you would be left with ten thousand shares at a price of $0.01
The share price goes up, (to dilutable levels…)
but you are left with fewer shares.
The problem with reverse splits
is they are seen as the worst possible event in the penny stock world,
and almost always lead to a massive selloff when they're announced,
and then often once they are executed.
In the aftermath the stock you own that started off at .01 post split,
might settle at .0035 or so.
You're left holding onto a 65% loss,
but the company is left with 35 ticks of share price to dilute…
Trip-zero stocks have the highest risk of reverse splits
because it is usually the company's only option to continue 'utilizing' the stock,
and most trip-zero stocks didn't get there
from solid management and profitable business plans.
Many are scams and dilution schemes that will dilute to oblivion,
reverse split, rinse and repeat.
To pull off a successful trip-zero trade,
here are some tips and rules to consider following:
http://www.pennystocknation.com/tripzeropennystocks.html
Paid Bashers / Short Attack
DEFINITION of Stock Basher
An individual, either acting alone or on behalf of someone else,
who attempts to devalue a stock
by spreading false or exaggerated claims against a public company.
After the stock's price has dropped,
the basher, or the basher's employer, will then purchase the stock at a lower price
than what he or she believes it is intrinsically worth.
This is an illegal activity that can carry significant legal repercussions.
The basher generally benefits on how effective the negative rumors are,
which can dramatically affect a stock's value.
If an investor believes the false claims,
he or she may sell off the stock at the higher price before it falls.
The basher will then purchase the stock and ride out the gains.
http://www.investopedia.com/terms/s/stockbasher.asp
Market Manipulation
Stock Bashing
"This scheme is usually orchestrated by savvy online message board posters (a.k.a. "Bashers")
who make up false and/or misleading information about the target company
in an attempt to get shares for a cheaper price.
This activity, in most cases,
is conducted by posting libelous posts on multiple public forums.
The perpetrators sometimes work directly for unscrupulous Investor Relations firms
who have convertible notes that convert for more shares the lower the bid or ask price is;
thus the lower these Bashers can drive a stock price down
by trying to convince shareholders they have bought a worthless security,
the more shares the Investor Relations firm receives as compensation.
Immediately after the stock conversion is complete
and shares are issued to the Investor Relations firm, consultant, attorney or similar party,
the basher/s then become friends of the company
and move quickly to ensure they profit on a classic Pump & Dump scheme
to liquidate their ill gotten shares
http://en.wikipedia.org/wiki/Market_manipulation
Paid Bashers
The shorts will hire paid bashers who “invade” the message boards of the company.
The bashers disguise themselves as legitimate investors
and try to persuade or panic small investors into selling into the manipulation.
This is not every dirty trick that the shorts use when they are crashing the stock.
Almost every victim company experiences most or all of these tactics.
The Anatomy of a Short Attack
Abusive shorting are not random acts of a renegade hedge funds,
but rather a coordinated business plan
that is carried out by a collusive consortium
of hedge funds and prime brokers,
with help from their friends at the DTC and major clearinghouses.
Potential target companies are identified, analyzed and prioritized.
The attack is planned to its most minute detail.
The plan consists of taking a large short position, t
hen crushing the stock price, and, if possible,
putting the company into bankruptcy.
Bankrupting the company is a short homerun
because they never have to buy real shares
to cover and they don't pay taxes on the ill-gotten gain.
When it is time to drive the stock price down,
a blitzkrieg is unleashed against the company
by a cabal of short hedge funds and prime brokers.
The playbook is very similar from attack to attack,
and the participating prime brokers and lead shorts are fairly consistent as well.
http://counterfeitingstock.com/CounterfeitingStock.html
Paid “Internet Bashers”
“CELLAR BOXING”
http://www.stockmarketcats.com/showthread.php?t=6903
Rules of the Trade
for stock promotion plays
Never trade more than you can afford to lose.
Assume the trade can result in a total loss.
When the promo is over,
the share price typically falls greater than 50%
within 1 hour and never recovers.
Never use the word "invest"
( "trade" micro caps never "invest" in micro caps).
Never take a "long position" on any micro cap
(attempt to exit within 1-5 days of entry,
99.99% of micro caps are scams & eventually drop to 0.0001).
Trade the ticker, not the company
(fundamentals are largely irrelevant).
Seek conservative gains of 10-50% per trade
(attempting gains in excess of 50% per trade will typically result in heavy losses).
Only enter a price dip
if there is forward momentum and high volume
and you have compelling market indicators
suggesting a quick recovery
(such as pending news or early promotion phase).
Seeking gains in excess of 50% per trade.
Trading late into the promotion
Trading greater than 50% of your account balance on any one trade.
Entering a position immediately following a large opening bell up gap.
Chasing an entry point over 25-50% from opening share price.
Failing to exit during high momentum and volume (exit when buyers are lined up)
Holding your position for greater than 5 days and holding a position over the weekend.
Holding your position for the pomotors promised price targets (they are all lies to encourage buying).
Entering any position after the first selloff "dump" of the "pump & dump"
Don't forget,
as the promo enters the later phases
or post selloff phase,
the promotors price targets become more and more exagerated
(don't fall for it, these are warning signs to the savvy traders that it's time to move on).
Stocks of many start-up companies,
bottom at the "Triple 000" price level,
before they begin their meteoric rise.
"Venture Capitalists"
like to buy the shares of these companies at these low levels.
Anytime you have the financial means
to buy a "Trip" for 0.0002 to 0.0009,
do it !!
Try to buy 10,000,000 shares, and "trade" them.
Your cost, to buy 10,000,000 shares of a stock at 0.0003 is $3,000.
Keep 1,000,000 shares in your account at all times,
to sell at a later date,
just in case your stock turns out to be a high flier
months down the road.
Many times,
these companies shares can end up selling for 0.50c, or, $1.00.
Enough said !!


Elliott Wave Theory interprets market actions
in terms of recurrent price structures obedient to the Fibonacci sequence.
Basically, Market cycles are composed of two major types of Wave :
Impulse Wave and Corrective Wave.
For every impulse wave,
it can be sub-divided into 5 - wave structure (1-2-3-4-5),
while for corrective wave,
it can be sub-divided into 3 - wave structures (a-b-c).
The attractiveness of Elliott Wave Analysis is :
Three impulse wave forms
and six corrective wave forms are conclusive.
All we have to do
is to identify which wave form is going to unfold
in order to predict future market actions.
http://www.acrotec.com/ewt.htm
http://stockcharts.com/help/doku.php?id=chart_school:market_analysis:elliott_wave_theory
IMPORTANT !!
View this Video before you invest your money !!
"Wave One" is the Wave right after a prolonged downtrend.
This stock has been going down,
but now it is starting to trade sideways , forming a base.
The sellers who once had the upper hand,
are now beginning to lose their power,
because the buyers are starting to get more aggressive.
The stock just drifts sideways without a clear trend.
Everyone hates this stock!
This is the time to be Loading the Boat !!
Example:
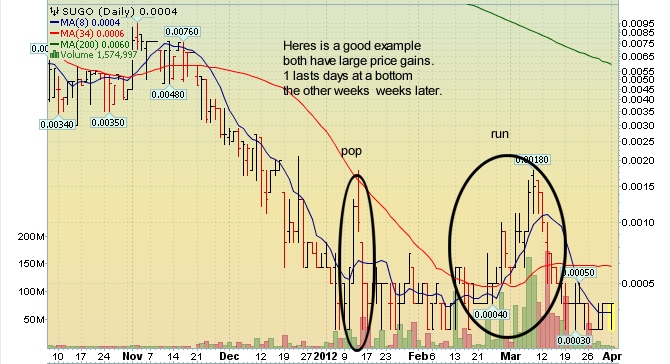
SUGO
This stock had a prolonged downtrend in November and December,
and finally found its "Key-support" at 0.0003 in January.
(This is the area where Promoters were accumulating their shares.)
It then had an "Attention-Pop",
then a "Drop",
formed a base,
then began its "Run",
to complete its "cycle".
Dec-Jan-Feb
( The QTR ended Feb 29th )
Two Promoters announced their Promotions
after the QTR ended,
igniting a "Run".
When you see the "Promote",
time to exit the Boat.
Sunday, March 11, 2012
SUGO (Sungro Minerals Inc) -
Our Next GDSM Gold Runner Poised For .02+ Cents ?
SUGO .0014 -
We first alerted our VIP Subscribers SUGO
with the bid at .0005 and the ask at .0006 cents several weeks ago.
This week we alerted our FREE members at .0011 cents.
The stock suddenly broke out this week
giving our VIP Subscribers and easy 200% in gains potential
from our alert when it hit an intraday high of .0018 cents on Thursday.
The good part is there appears to plenty of gas left in its tank for SUGO
to do what many investors failed to realize it is capable of
as it attempts to take a shot at making history once again.
This Gold stock caught our attention
after seeing its dramatic fall
from last years .02 + cents trading range.
http://www.pennystockgeeks.blogspot.com/
Finally, stocks "break out" into "Impulse Wave 3", which begins the uptrend.
This is where the majority of the money is made in the stock.
The fundamentals are bad, the outlook is negative, etc.
You'll be aware that the stock is climbing.
The following "Signs" show you, that you should be "Selling" your stock.
1. Your stock is listed on the Top of the "Breakout Boards" List.
2. Your stock is listed on the "Top 10 Active Stock Market Forums".
3. The number of posters on your stocks board are increasing every day.
The number of followers are increasing each day.
The number of posts are increasing each day.
4. Everyone is cheering and celebrating !!
You'll see "Stock Promoters" promoting your stock,
at the top of "Waves 3 and 5".
This is your "Sign" to consider "Selling" your stock!
Example:
http://investorshub.advfn.com/boards/read_msg.aspx?message_id=73014587
Promoters are paid to promote.
They become visible at the top of "Waves 3 and 5".
This is your First Sign to get out !
When they Promote, time to jump out of the Boat !
They announce price targets that seem unreal.
Both they themselves and their clients, own large amounts of the stock,
so they want to raise the attention level on the stock,
so the stock goes higher,
allowing them to sell both their shares,
and their clients shares, to you, at the higher price level.
Posters are telling everyone that the stock is going much higher.
Posters are naming price targets that seem unrealistic.
You are getting "Greedy".
You believe the stock can climb higher,
and you are getting caught-up in the greed emotion.
The enthusiasm over the stock is enormous!
Ahhh, but professional traders know better !!
Traders, who had accumulated shares at the lows, weeks, and months earlier
are getting ready to "dump it off " to those getting in late.
Get ready to "Sell and Unload" as the stock is climbing.
As the stock is climbing, you should be considering taking your profits!
This sets up "The Corrective Waves",
the "WARNING" stage!!
Finally, after the glorious advance of "Waves 3 and 5",
the stock begins to trade sideways again and starts to "churn".
Novice traders are just now getting in!
This stage is very similar to Wave 1.
Buyers and sellers move into equilibrium again
and the stock just drifts along.
The stock is "Topping-Out" ! Last chance to Sell !
You want to Sell your stock in "Wave 3 or 5",
before if falls below the "highest moving average".
It is now ready to begin the next Wave,
Corrective Waves b,c
"The Dump"
The Final Stage.
Nobody believes the downtrend!
Everyone still loves this stock.
They think the downtrend is just a "correction".
Wrong!
They hold and hold and hold,
hoping it will reverse back up again.
They probably bought at the end of Wave 3 or 5,
or during Corrective Waves a,b.
Good chance that the stock will now revisit the lows of the base.
If you held the stock all the way down,
from Waves 3 and 5,
into this Corrective Wave a,b,c,
you have lost a large part,
if not all of the profits,
that you had made from Waves 1,3 and 5.
All of your money, is not totally lost though !
There is a light, at the end of the tunnel !
Every cloud has a silver lining !
The market often times gives you a second chance,
to get your money back.
You can begin to re-evaluate and accumulate at the base,
where most new runs begin.
Suggested Strategy for Playing the "Trips"
Sell what's HOT !
Buy what's NOT !
When you see the Promote !
Time to exit the Boat !
Buy on the Capitulation !
Sell on the Celebration !
Buy after the Dump!
Sell on the Pump !
Buy on the Rumor !
Sell on the NEWS !
Buy on the Fear !
Sell on the Cheer !
Buy after an Elliott Wave 5-Wave Decline
https://investorshub.advfn.com/boards/read_msg.aspx?message_id=141851365
Sell after an Elliott Wave 5-Wave Advance
https://investorshub.advfn.com/boards/read_msg.aspx?message_id=141851368
IMPORTANT !!
First,
never chase a running stock.
Second,
" trading emotion" is the easiest way to loose money.
"Trips" stocks
can have huge price percentage moves up, and down.
In general,
"Buy" them, when they are down,
and "Sell" them, when they are up !
This strategy applies to
"the day trade",
"the weeks trade",
as well as
"the monthly trade".
Always
"Buy when the stock is down",
and always
"Sell when the stock is up".
When your stock moves-up,
and goes through a "key resistance" price level,
and the stock is registering
a better than + 50% increase in price
from the previous days close,
it is wise to consider taking some profits,
by selling a portion of your holdings.
"Today's winners",
are often times,
"tomorrow's losers".
When a "Trip" stock climbs + 50% today,
it can, and often does,
lose - 50% to -100%
of that gain,
over the next several days.
So remember the "old adage"...
"You'll never go broke, taking a profit !"

Glossary
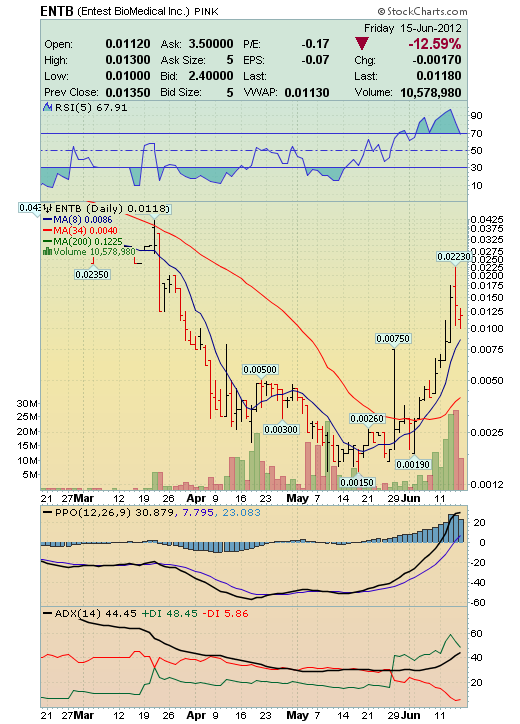
Bullish Divergence
A Bullish Divergence exists,
when the price is down trending
and either the RSI, or the PPO blue bars, are up trending.
Divergence means that 2-indicators,
are moving in opposite directions.
Example: ENTB

Fibonacci Retracement
Percentage Levels
https://investorshub.advfn.com/boards/read_msg.aspx?message_id=141214221
Fibonacci Numbers
http://www.stockta.com/cgi-bin/school.pl?page=fib
Fibonacci Retracements
* Golden 61.8% Retracements
* Moderate 38.2% Retracements
* Common 38.2% Retracements
http://stockcharts.com/school/doku.php?id=chart_school:chart_analysis:fibonacci_retracemen
Fibonacci Retracements
http://investorshub.advfn.com/boards/read_msg.aspx?message_id=77145842
________________________________________________________________
Fibonacci Numbers
are commonly used in Technical Analysis
with or without a knowledge of Elliot Wave Analysis
to determine potential support, resistance,
and price objectives.
The most popular Fibonacci Retracements are
61.8% and 38.2%
61.8% retracements
imply a new trend is establishing itself.
38.2% retracements
usually imply that the prior trend will continue
38.2% retracements
are considered natural retracements in a healthy trend.
Fibonacci Retracements
can be applied after a decline
to forecast the length of a counter-trend bounce.
________________________________________________________________
The 50% retracement is not based on a Fibonacci number.
Instead, this number stems from Dow Theory's assertion
that the Averages often retrace half their prior move.
50% retracement
implies indecision.
Dilution
What is Dilution?
Is it good, or bad ?
Dilution is when the company moves shares
from the AS (authorized shares)
to the OS (outstanding shares) or tradeable inventory,
for cash investments in the company.
This means there are more shares at the same market price
and reduces the size of the EPS.
It doesn't reduce the price or value of the stock.
But many pennylanders think it does.
Dilution doesn't change price,
it changes EPS.
Creating loss in company value,
not stock value.
Hardly 1 in a 1000 OTC companies
have an EPS to effect.
So, dilution can't effect their company value in the first place.
Whats the value of no earnings,
thus no EPS.
But, the value of more cash to a startup is huge!
Cash gives them the ability to attempt to grow.
Without the cash it can't.
So logic says,
the retail herd should be happy about dilution.
After all,
they want the comapny to grow don't they.
On the OTC,
"dilution" is the best news one can hear !
Not only does it give the company a chance at growth,
it doesn't effect their EPS value one bit.
They have no EPS to effect.
Plus,
every time VCs get there hands on large amounts of shares,
they buy a run,
and we can trade for profits !
So,
"dilution" is a win for the company,
a win for the Venture capital firm,
and a win for the educated pennyland trader,
on the OTC.
Funding
Remember,
"start-up companies"
have no business except "selling stock".
http://investorshub.advfn.com/boards/read_msg.aspx?message_id=75262048
One of the easiest ways,
for a "start-up company"
that trades on the OTC,
to gain the attention it wants, i
s to get "promoted".
In many cases,
the compensation to the
" Promoter " is "in shares".
To be more precise,
the shares are "restricted shares" by the company,
and "free trading shares"
from an undisclosed third party.
In the "start-up stage",
the Promotion will give the company some publicity,
however, it may not lead to the desired results,
due to the "share-based compensation".
That's not necessarily a bad decision
on the part of the company's management.
They just may not have the option to pay in cash.
The thing about "promotions",
is that they tend to work better,
when "paid with cash".
Venture Capitalist - VC
A "venture capitalist"
is a person who invests in a business venture,
providing capital for start-up or expansion.
"Venture capitalists"
are looking for a higher rate of return
than would be given by more traditional investments.
A "venture capitalist"
can be a "professional investor" ,
or "Market Maker".
The "venture capitalist"
may have no business experience
applicable to the industry your company is involved in,
and
is focused on "the potential rate of return"
your company can provide.
http://sbinfocanada.about.com/cs/financing/g/ventcap.htm#
"Promoters"
are "Venture Capitalist" firms.
"Venture capital"
(VC)
is financial capital
provided to early-stage,
high-potential,
high risk,
growth startup companies.
The "venture capital" fund
makes money
by "owning equity-shares"
in the companies it invests in.
http://en.wikipedia.org/wiki/Venture_capital
Price "Pull-Down"
where the price falls HUGE
over a relatively short period of time.
All "you" need to remember,
is that with ALL "pull-downs",
the "accumulation" starts.
This is just the first step!
As with all of these,
it's early before any play can be expected.
A "pop",
and possible
"double bottom",
then a basing of volume
to within the OTC volume range for "big guy" plays,
then a breakout and play,
if anything happens at all.
Just look at your stock,
and read some of the old saved posts in the sticky post area.
Price pull downs are OTC game stock.
They hover higher for months and months,
with NO retail interest or volume.
The insiders "pull the price down",
for the funding of their operations,
by increasing the "shares outstanding"
and "authorized shares",
and when the price of the stock,
reaches the price level
where the "VC"s want to "Buy",
the stock finally bottoms,
and you then see the accumulation.
Most every stock "pennylanders"
like these types of stocks.
There is another term for trading these OTC sub & Micro stocks.
"Bottom feeder" stocks.
The accumulation is "bottom feeders" moving in.
http://investorshub.advfn.com/boards/read_msg.aspx?message_id=72284717
http://investorshub.advfn.com/boards/read_msg.aspx?message_id=74348830
"Bottom Bounce"
"Bottom Bounce Plays",
are where you will see strong volume accumulation
at the bottom level.
Thats how you know the bottom is reached.
The volume surges, and the price stops falling.
"Price Pull-Down", and "Bottom Accumulation"
is an OTC "tell" or "signal", that "funding" may be taking place
"Bottom Volume Surges"
are insiders and friends, buying before a "bought manipulated OTC funding run"
"Darkside Play"
> Volume accumulation at bottom.
> Signaling it's really the bottom.
This is when most "VC", "Venture Capital", funding deals start.
So, it normally takes weeks, to a month, or so, before any "Darkside Play" can be expected.
Keep an eye on "volume build", as retail interest increases.
Remember the big guy volume rule of thumb for starting a "Darkside Play".
This will help in guessing if any pop works, because sometimes a "second" or "third" pop is needed, to get the interest levels high enough, for them to actually act on their "Planned Play".
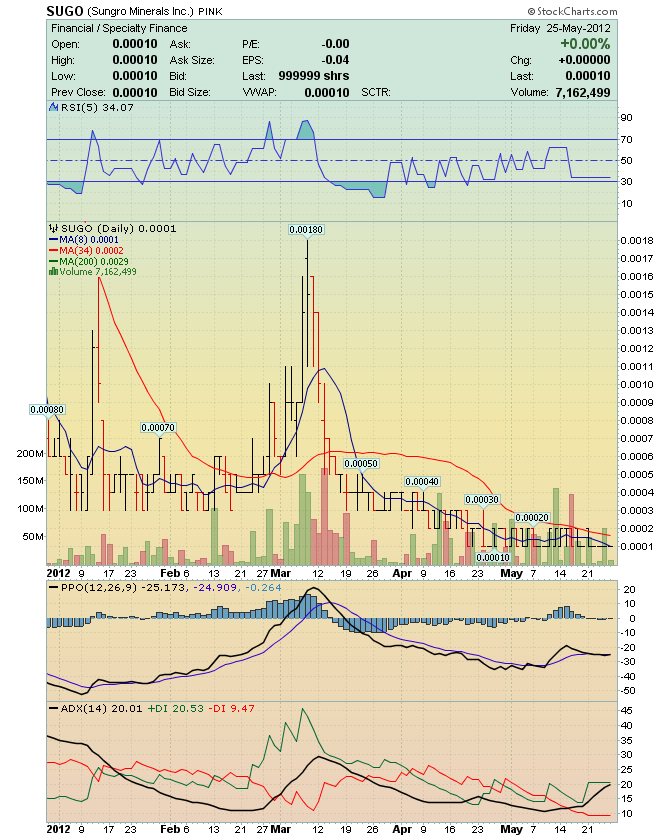
"Attention-Pop"
Example:
SUGO
If it looks like a "pop", its a "pop".
If it looks like a "run", its a "run".
SUGO has just given the "first", of several "Attention-Pops" ,
taking the average daily volume, from under 10 mill, to above 50 mill,
the goal of all "Attention-Pops" !
SUGO's "Pop" action,
is the "attention getting move",
before the "real thing",
which is the "Run".
"Share Shifting"
is important to OTC stocks
It shows a setup, before a "bought price run".
To get this run, big guys need to accumulate large amounts of shares at LOW cheap prices.
So, when they buy and manipulate,
to sell to "retail emotion" shareholders, they make large profits from their funding investments.
"Pond-Fishing Play"
aka "The Patience Play"
This is a 6-month waiting period play.
Called a "pond", because it starts from a dead still pond surface in price.
This means that there is a long period of time with no price movement at all.
There are 3-volume surges during this time to signal random accumulation at these low prices.
That one action, of 3-volume surges, without price change, is an OTC "tell" or, "signal", that funding may be taking place.
You can weekly watch, to see what happens in the future.
http://www.youtube.com/watch?v=J1BpICTP9jA
Trading "Gaps"
http://stockcharts.com/school/doku.php?id=chart_school:chart_analysis:gaps_and_gap_analysi


Example: SUGO
http://investorshub.advfn.com/boards/read_msg.aspx?message_id=76226544
In the January and February "Walkdown",
you will notice 3 - "Breakaway Gaps" .
0.001
0.0007
0.0005
ALL of the "gaps" got filled
as the stock started climbing into March.
Breakaway Gaps are usually closed over time.
You see them in a multiday "emotion run" ,
or "walkdown" ,
where the stock price is trending around,
over several months.
The retail mindset returns to logic,
and fills the gap with the retrace.
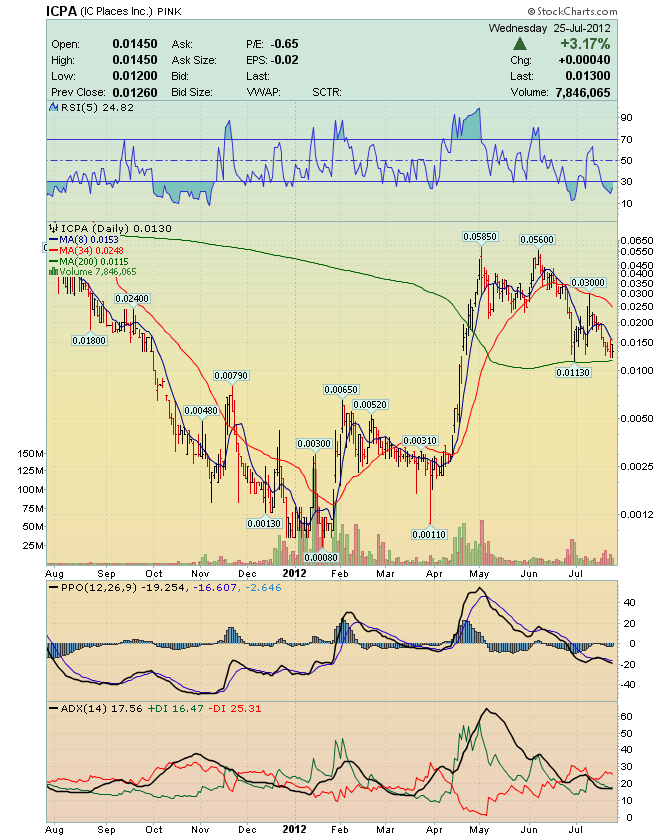
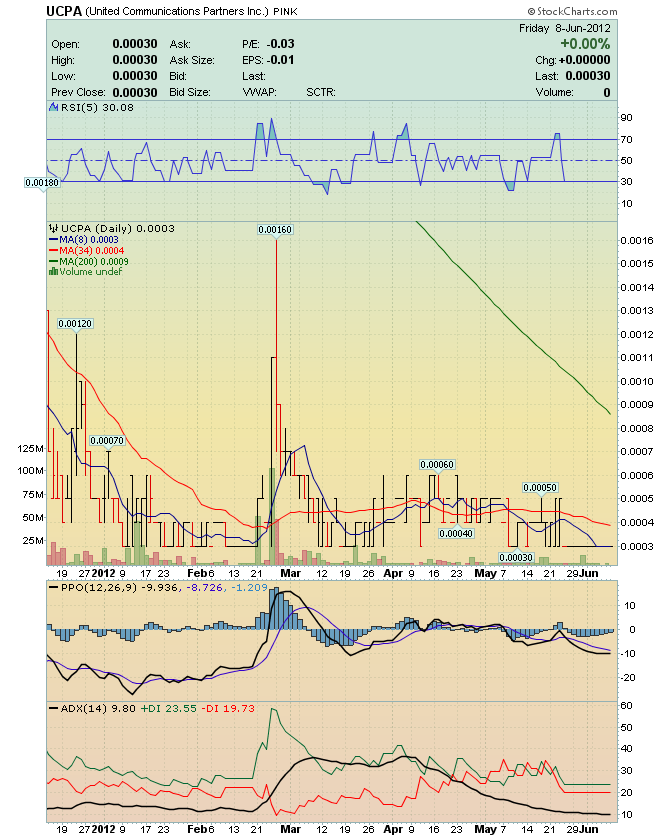
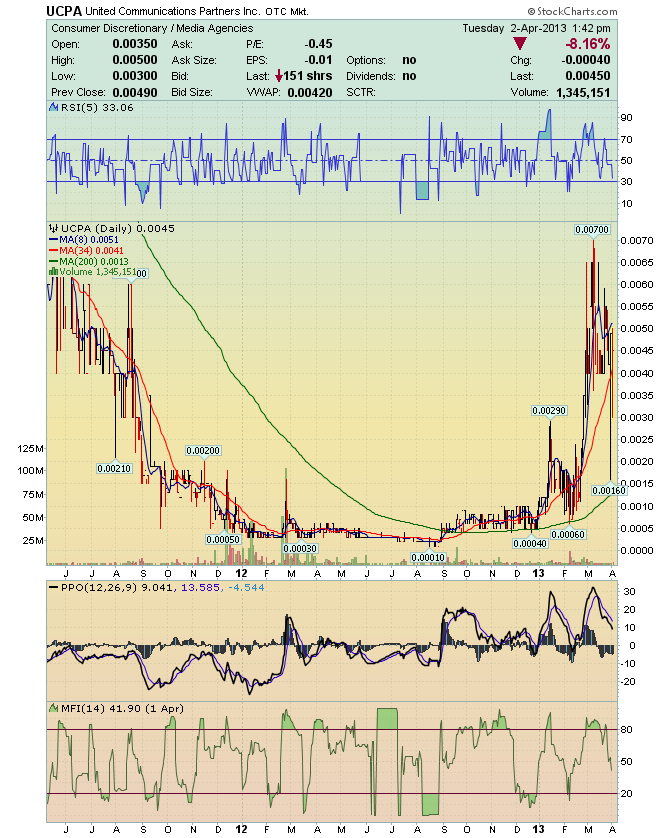
Example: UCPA
http://investorshub.advfn.com/boards/read_msg.aspx?message_id=76226544
In the January and February "Walkdown",
you will notice 3 - "Breakaway Gaps" .
0.0007
0.0005
0.0004
ALL of the "gaps" got filled
as the stock started climbing into March.
Breakaway Gaps are usually closed over time.
You see them in a multiday "emotion run" ,
or "walkdown" ,
where the stock price is trending around,
over several months.
The retail mindset returns to logic,
and fills the gap with the retrace.
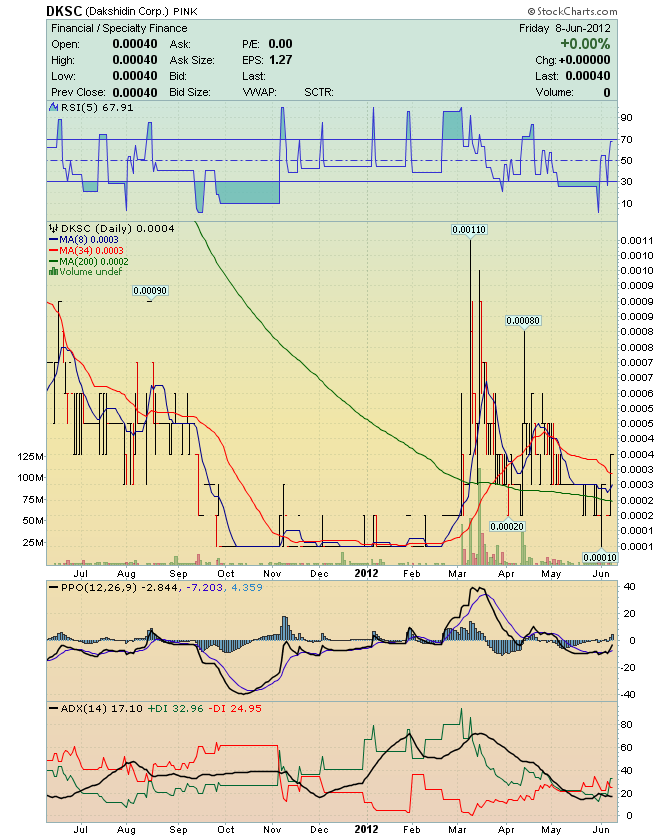
Example: DKSC
http://investorshub.advfn.com/boards/read_msg.aspx?message_id=76226544
In the June 2011 thru February 2012 "Walkdown",
you will notice multiple - "Breakaway Gaps" .
0.0009
0.0005
0.0003
0.0001
ALL of the "gaps" got filled
as the stock started climbing into March.
Breakaway Gaps are usually closed over time.
You see them in a multiday "emotion run" ,
or "walkdown" ,
where the stock price is trending around,
over several months.
The retail mindset returns to logic,
and fills the gap with the retrace.

The "Flat Liner" Chart
This is a "very risky" chart pattern,
and NOT a good chart pattern to trade !
The RSI and the Price both go flat.
Your stock looks like it's sleeping, or dead !
Some charts will resemble the "Pond-Fishing Play".
This chart pattern may be caused by either a "manipulated walk down",
by Market Makers, and/or Insiders,
or, the company is going under,
effecting a "Reverse Stock Split" ,
or, will soon be delisted.
Despondency and Depression describe this situation,
as shareholders watch their account value drop to nearly zero !
This is "the lowest level" that a stock can get to,
in an accumulation phase.
The stock will have a
Bid 0.00 - Ask 0.0001
in most cases.
The "negative news"and aggressive sellers,
have now over powered any "positive news" and buyers.
Most everyone hates this stock.
Shareholders who are still holding shares,
are referred to as "Bagholders".
Just as the patient without a pulse,
when everyone thinks the patient is dead,
shareholders start to believe their shares are dead,
and will never move again.
Some of these stocks will stay flat for a few weeks,
while others will stay flat for months.
You don't want to tie your money up for this lengh of time !
The price is pulled down to anywhere from
0.0001 to 0.0005,
usually with some sort of negative event,
being associated with the drop.
Some of these plays will "recover" and come back to life,
after some kind of positive news is announced,
but, most will NOT recover !!
They are just NOT worth trading !!
Examples
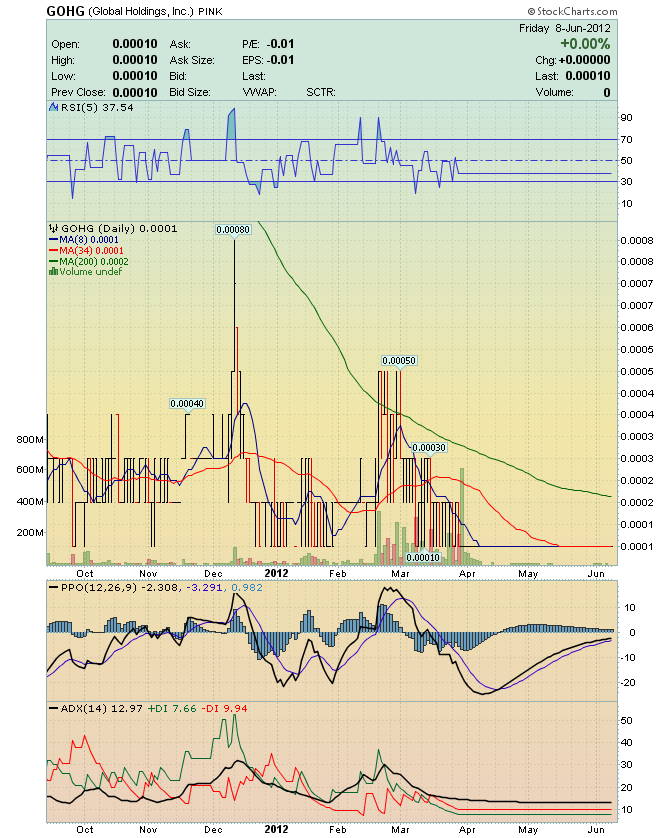
GOHG
http://ih.advfn.com/p.php?pid=squote&symbol=gohg
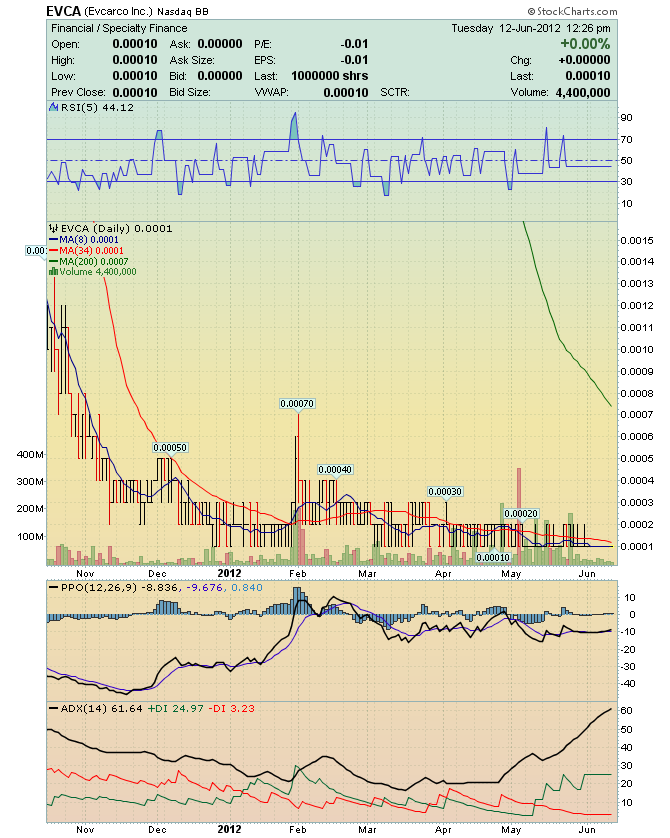
EVCA
June 5 - A " reverse split " > holders will receive 1 Share for every 500
to take effect on or after June 20, 2012
http://ih.advfn.com/p.php?pid=nmona&article=52661475
http://ih.advfn.com/p.php?pid=squote&symbol=evca
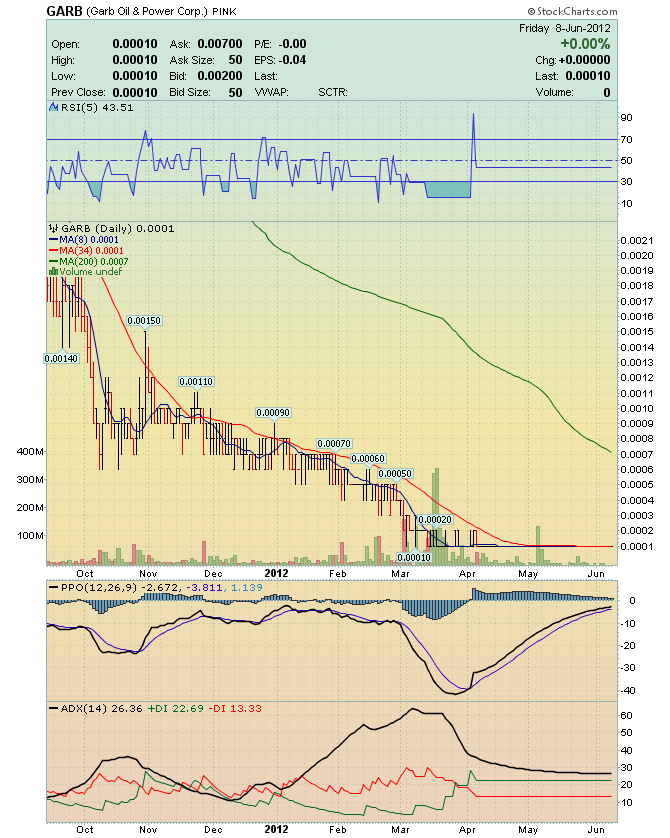
GARB
April 5, 2012
GARB announces agreement to restructure, " reverse split "
http://www.otcmarkets.com/stock/GARB/news
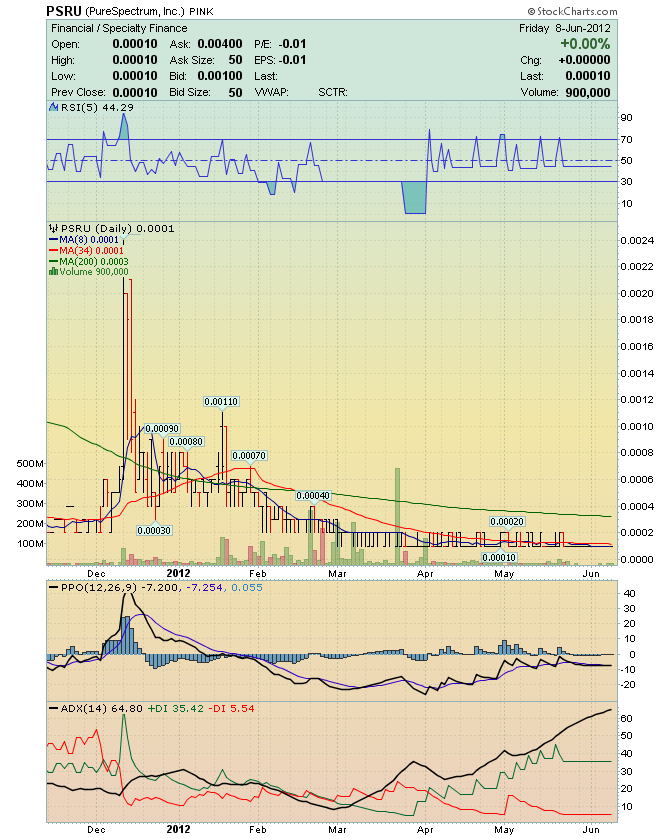
PSRU
http://ih.advfn.com/p.php?pid=squote&symbol=psru
SUGO
March 2012
the Company increased the authorized shares of common stock of the Company
from 750,000,000 to 2,500,000,000 shares.
http://nvsos.gov/SOSEntitySearch/corpActions.aspx?lx8nvq=sckzhSFMshhHTv%252bezK7qFA%253d%253d&CorpName=SUNGRO+MINERALS+INC.
http://ih.advfn.com/p.php?pid=nmona&article=51663577
http://ih.advfn.com/p.php?pid=squote&symbol=SUGO
http://www.otcmarkets.com/stock/SUGO/financials
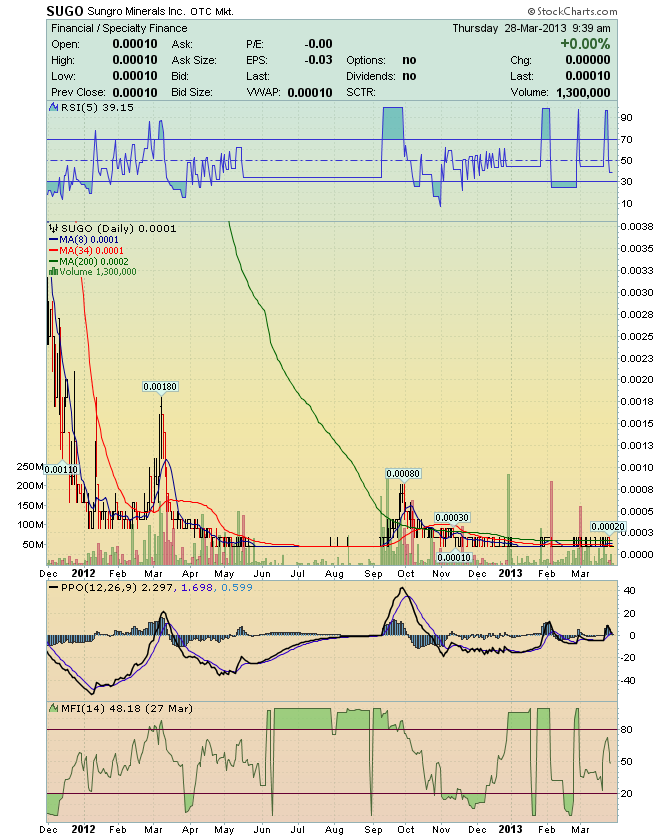
After a New prolonged downtrend, below the previous 0.0003 "Key-support",
the stock has now hit "rock bottom" at
Bid 0.00 - Ask 0.0001
Bid / Size 1.5 Mill - Ask / Size 216 Mill
and has traded sideways for 7-weeks.
If you are buying shares of SUGO,
you are most likely buying them from a " Market Maker "
who has a large inventory to unload to buyers.
The "shares are illiquid",
and you may not be able to sell your shares,
since the Bid is at 0.00
"Shareholders may be unable to sell their shares.
There is currently a limited market for our common stock,
and we can provide no assurance to investors that a market will develop.
If a market for our common stock does not develop,
our shareholders may not be able to re-sell the shares
of our common stock that they have purchased
and they may lose all of their investment in the company".
March 2012
the Company increased the authorized shares of common stock of the Company
from 750,000,000 to 2,500,000,000 shares.
Then look at what suddenly happened in September,
to everyones surprise !
All of a sudden this No Bid stock jumped to Bid 0.0001 Ask 0.0002
Traders started Buying up shares like crazy,
in June, July and August, at 0.0001,
because the Authorized Shares had increased,
then in September the company made a surprise announcement,
and traders saw a Run develope out of nowhere,
lifting the stock to a High of Bid 0.0007 Ask 0.0008
UCPA
March 12, 2012
to terminate the registration of its common stock and suspend its reporting obligations
http://www.otcmarkets.com/edgar/GetFilingHtml?FilingID=8473906
http://www.otcmarkets.com/stock/UCPA/financials
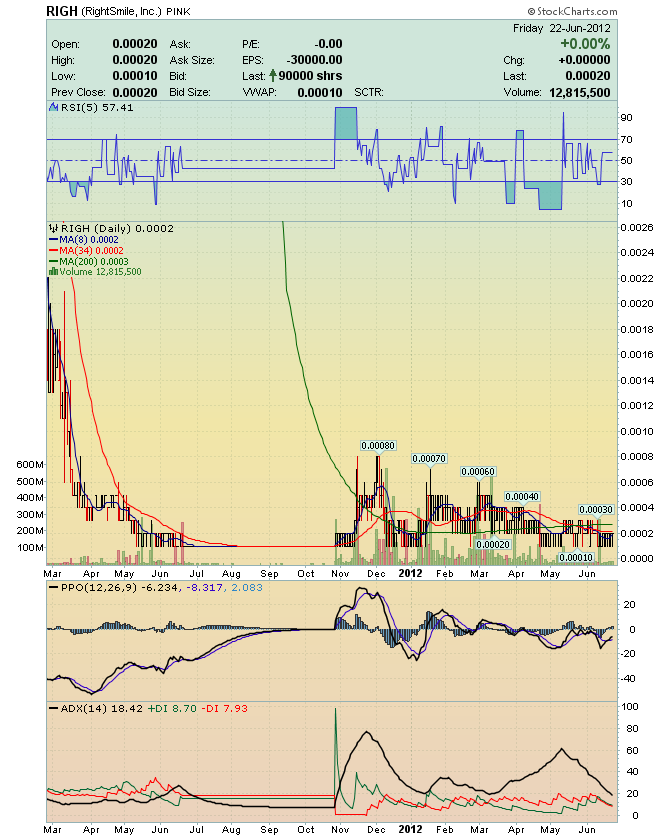
RIGH: Recovered
http://investorshub.advfn.com/boards/read_msg.aspx?message_id=76900417
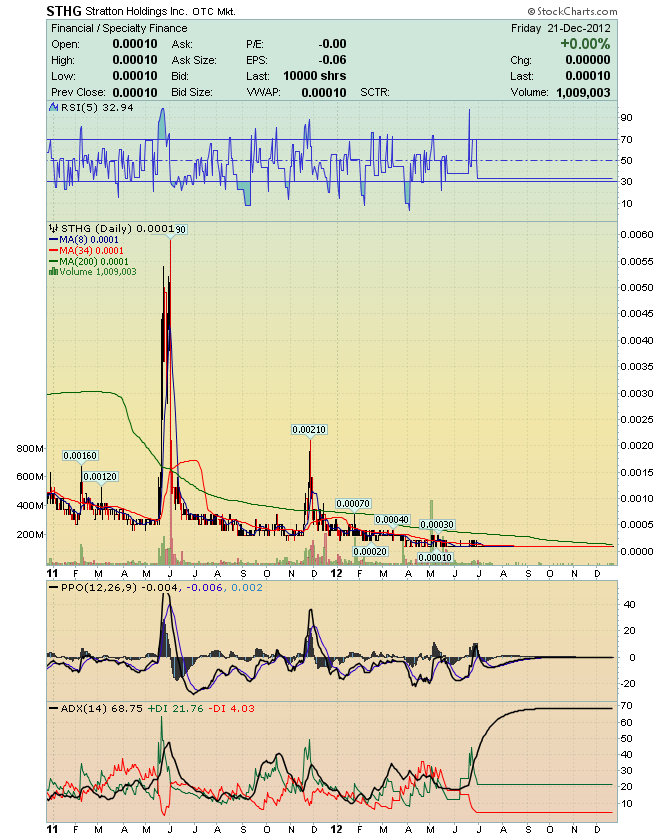
STHG : Recovering
http://investorshub.advfn.com/boards/read_msg.aspx?message_id=76498921
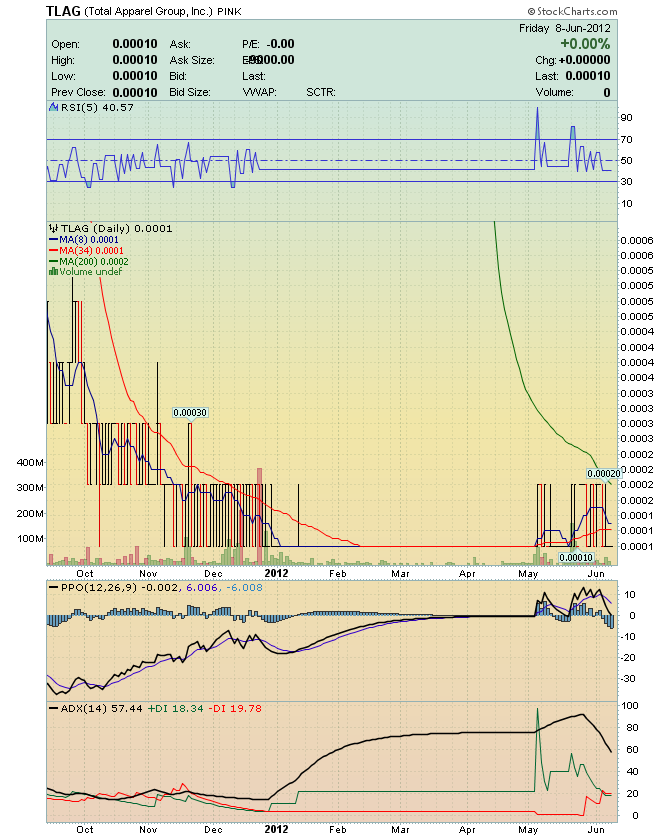
TLAG: Recovering
http://www.otcmarkets.com/stock/TLAG/company-info
http://www.otcmarkets.com/stock/TLAG/financials
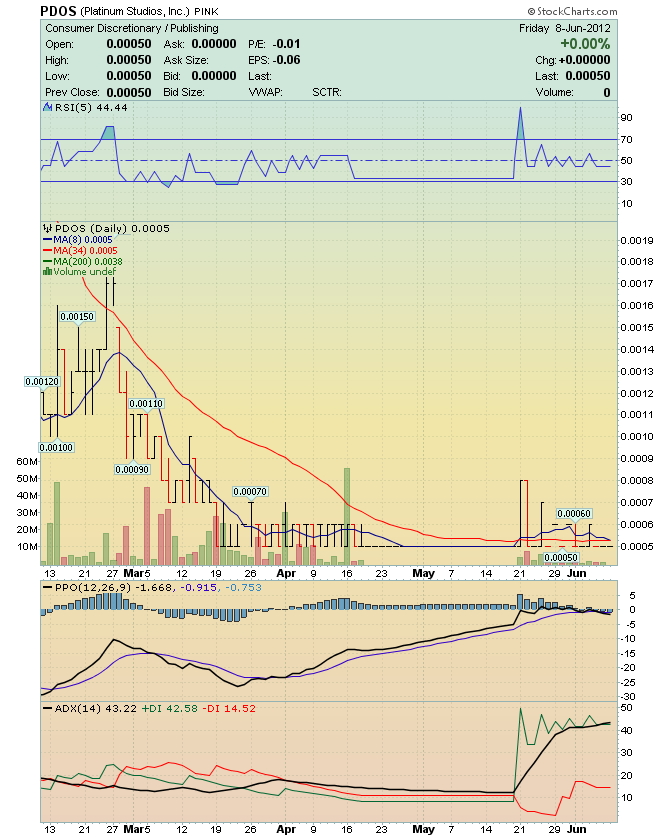
PDOS: Recovering
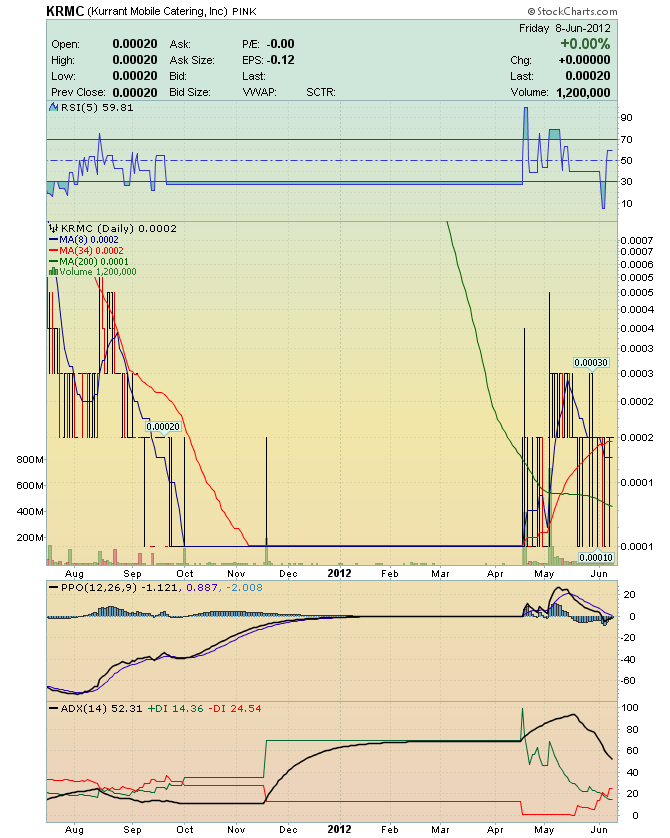
KRMC: Recovering
http://investorshub.advfn.com/boards/read_msg.aspx?message_id=76470209
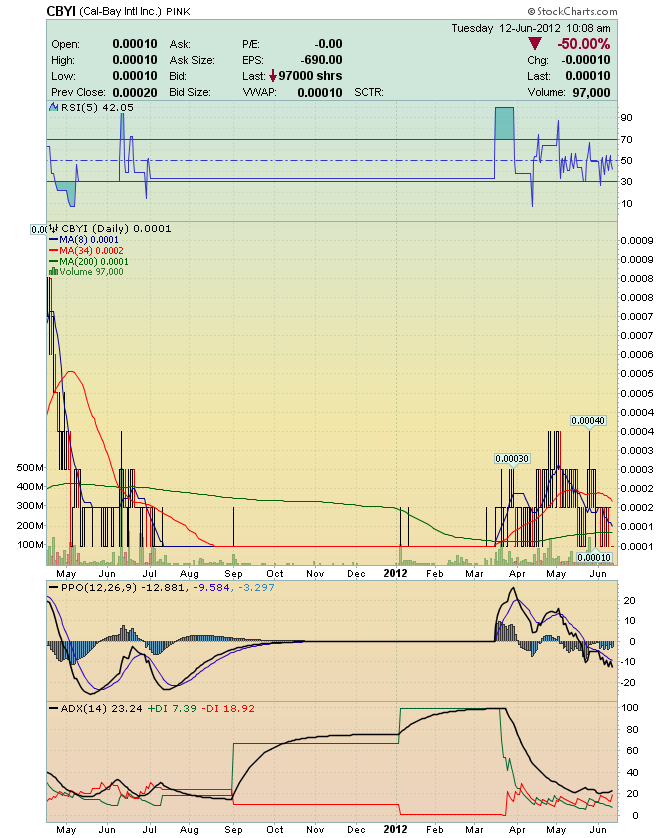
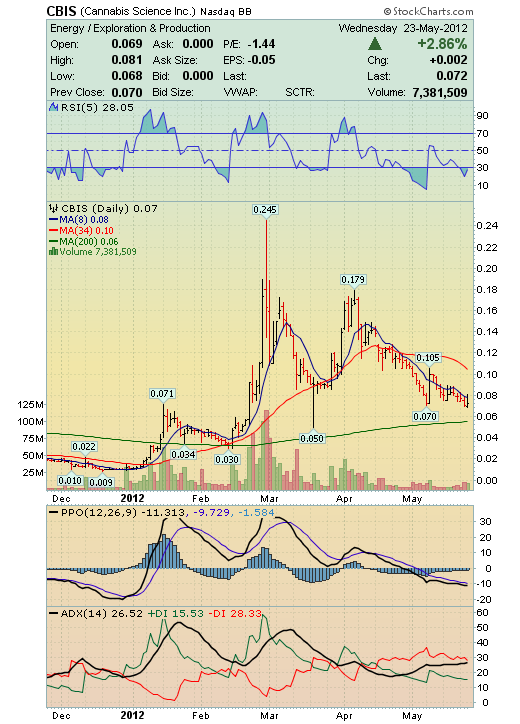
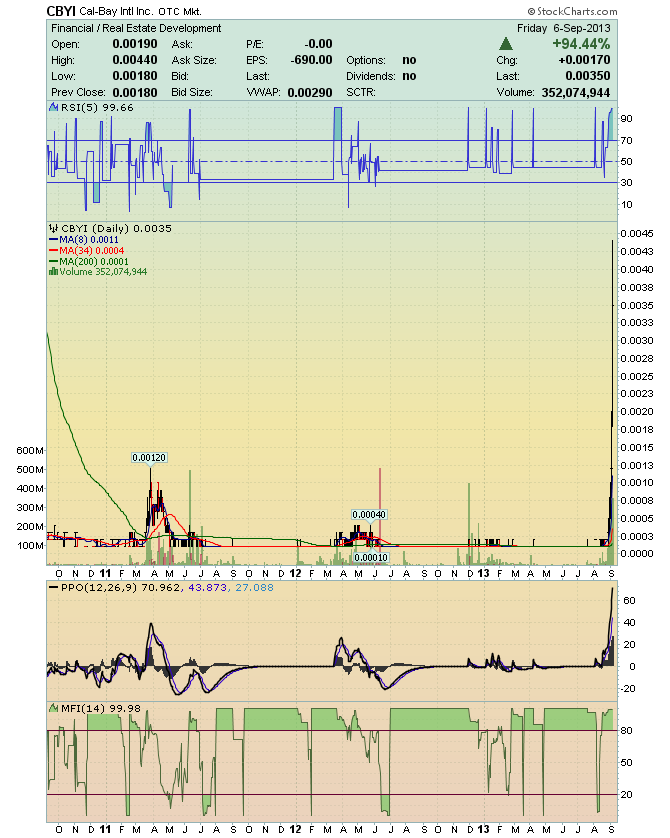
CBYI: Recovering
http://ih.advfn.com/p.php?pid=squote&symbol=cbyi
April 30 - Signs LOI for Joint Venture Ownership
http://ih.advfn.com/p.php?pid=nmona&article=52209363
April 16 - Appoints New CEO
http://ih.advfn.com/p.php?pid=nmona&article=52021215
March 28 - Retires 400 Million Shares of Common Stock
http://ih.advfn.com/p.php?pid=nmona&article=51802399
March 23 - DTCC Chill Clarification
http://ih.advfn.com/p.php?pid=nmona&article=51752600

DKSC: Recovering
http://ih.advfn.com/p.php?pid=squote&symbol=dksc
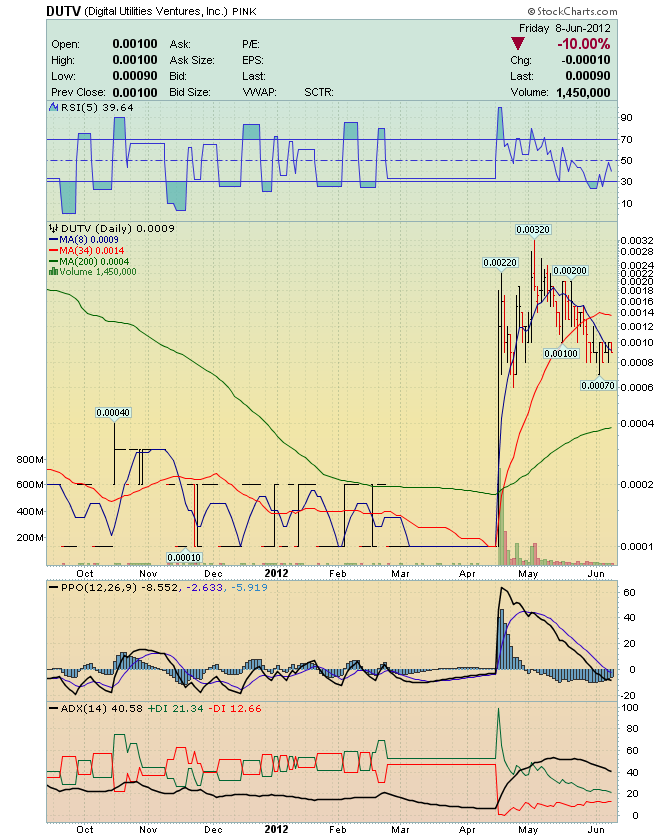
DUTV: Recovering
http://ih.advfn.com/p.php?pid=squote&symbol=dutv
The "Pincher" Play
The "Pincher Play",
is an "early" method of getting in before the "pump" starts.
The PPO and ADX "Pinch"
MrBigz Pincher Video Lesson
http://www.screencast.com/t/7FR3BYxeD
Examples
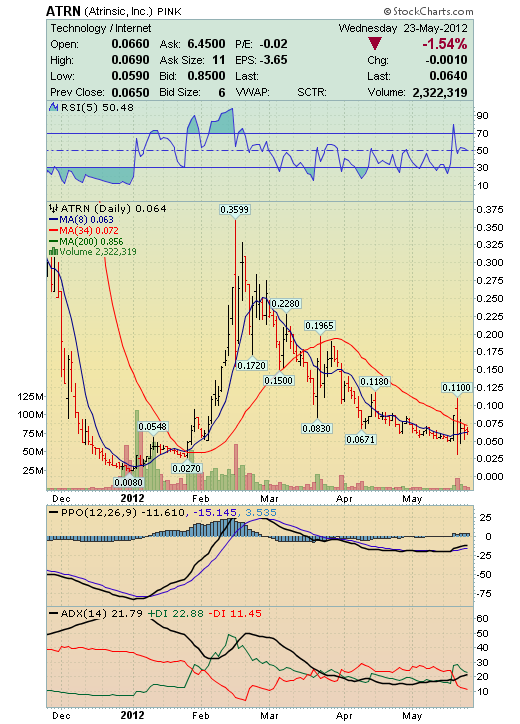
ATRN "Pincher",
The ADX and PPO "Pinched" in late December
made a "45-fold move",
from 0.008 to 0.3599 !!
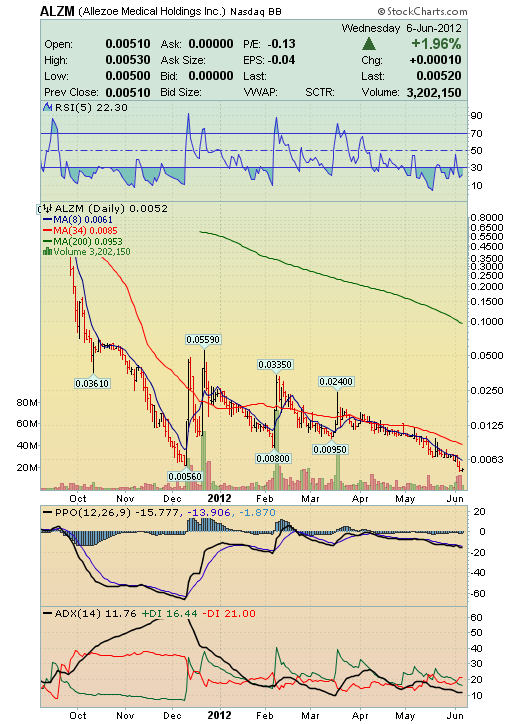
ALZM "Pincher"
made a 10-Fold move,
from 0.0056 to 0.0559 !!
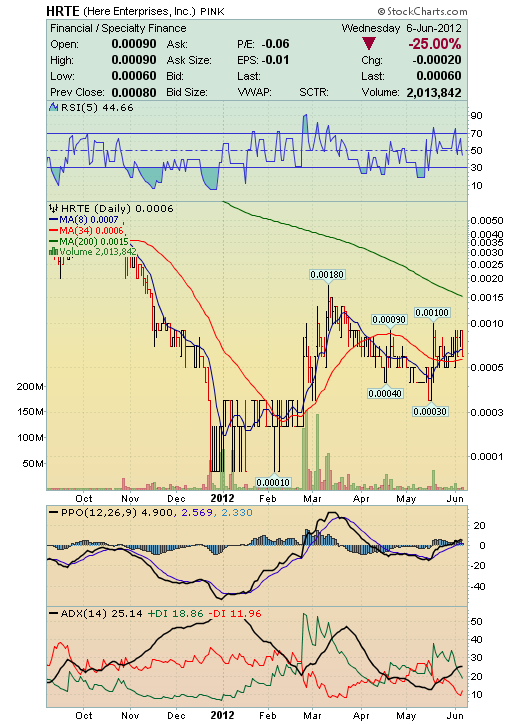
Price "Pull-Down"
HRTE "Pincher"
made a 10-Fold move,
from 0.0001 to 0.0018 !!
Price "Pull-Down"
Trading Chart Patterns
http://stockcharts.com/school/doku.php?id=chart_school:chart_analysis:chart_patterns
http://www.thestockbandit.com/chart-patterns/
Bullish Chart Patterns to look for

Double Bottom Buy
http://stockcharts.com/school/doku.php?id=chart_school:chart_analysis:chart_patterns:double_bottom_revers

Cup & Handle Buy
http://stockcharts.com/school/doku.php?id=chart_school:chart_analysis:chart_patterns:cup_with_handle_cont


| Volume | |
| Day Range: | |
| Bid Price | |
| Ask Price | |
| Last Trade Time: |


