News
News  Market Data
  Discover
Support: 888-992-3836
Copyright © 2023 InvestorsHub Inc.


Register for free to join our community of investors and share your ideas. You will also get access to streaming quotes, interactive charts, trades, portfolio, live options flow and more tools.
Hey SC welcome to the t/a 101 board /e
Welcome to the board -
$5 - $7 in 12 months. The TSXv is home to many big successes.
LOL - I just realized I was posting to this board - I thought we were on 10baggers board - Maybe I need sleep.
Bouncing between the 50 and 100dma's looking for a way out - you wanna nominate that as a 10bagger (wow that'd be $7) or just suggesting it as a play, if it gets above present resistance?
Not very often /e
Do you follow Canadian deals?
Support and Resistance:
The subject of support and resistance is really a hard one to tackle in just one lesson, so perhaps we will do a part one and two. Also, see the lessons on MA's, as 'moving averages' are great places for a moving pps to stop or pause, and then either breakthru or reverse.
The main thing to remember about support and resistance is that "people are buying and selling the stock". Again charting is more about psychology than anything else. One of the reasons we call a point a "resistance point" is that it represents the place where people "stopped buying", historically.
If you bought CDE @ 5.50 on the last run and held, I would expect you to consider getting out when it climbs back to that level. In fact, there will be sellers all along the path northward from the bottom here at 4.20ish. The pause (base) @ around 5.05 will be the 1st test of resistance. Again, it is logical to assume that people thought it was going to bounce there, and either entered or perhaps added. Folks will get off the bus betweeen 5.00 and 5.50 making it hard to breakout above that level.
As noted on the chart, there are smaller areas of resistance along the way. They are too numerous to mark them all, but I chose one.
The 4.43 - 4.81 area is a good example. See how the pps bounced at 4.43, rose to 4.81, fell back and rose again, building a little base before breaking out above that level, and moving on up to around 5.25 (where it built another little base), before running on to 5.50?
Always expect support and resistance levels to do just that, i.e. offer resistance to a run and support to a correction.
thanks.. I will spend some time this weekend going through the various steps, and between that, the NFL playoffs and Hockey night in Canada you won't need to add to0 much on my behalf LOL.. Methinks ahm gonna be real busy.
Welcome aboard - I have been meaning to add somemore... maybe this weekend.
this looks like the exact board that I could learn from. I have given it a boardmark and start going through the various links..thanx for the effort.. regardless of how I do LOL
I do - use both, usually for entry and exit - I swing trade, so I am thinking in days rather than hours, but the use of 3 day (or 5day) 5min chart or a 1 day 1 minute is often helpful in squeezing out that last % point -
Gotta play with the indicator periods to find what suits ya, but one IMPORTANT thing to remember is that when you change the chart time frame you are changing the indicator time frame as well!
Lot's of folk miss the fact that on a daily chart the MA's are 100dma / 50dma / 10 dma etc - DAYS
On a weekly chart they are 100wma (weeks) - On a 1minute chart the 60MA is 60 minutes!
Undestanding that helps in establishing the periods for MACD, RSI etc as well. If I am working intraday, I set things to relate to timeperiods of 15 minutes, 30 minutes etc.
btw - In a related issue - some chartists use the 22dma on the daily because there are normally 22 trading days in a month -
This all may be useless info to most, but perhaps will help some.
4God
Does anyone use 1 min and 5 min charts? I don't necessarily trade off the 1 min chart, but I use it as more of an early detection tool in trend changes. My usual indicators are
EMA(5,6)
EMA (13,21)
MA(10,50)
RSI, MACD, Bollies.
I'm hoping a few will chime in on their ideas so I can see how other ppl use these charts, thanks!
Merry Christmas all. May the season find you walking in the blessings of God, and may the coming year be one of health and prosperity for you and your family.
~For God in West Virginia~

Yes! lol StockAnalyzer, thats the one. Thanks Susie. Been so long.
Good call 4g! Hey whats the link to that stockcharts board I used to post at with glassy and ....??
appreciated /e
Alltogether an Excellent board and excellent posts....
Thanks 4God, it came up in a scan and I liked the chart too from what I could figure out.
I don't see any recent PR's but maybe something is cooking?
Thanks again!
Niters!
APNS annotated chart:
I like it Susie - note that today candle is a bit of a fake -the sell-off in the last 5 minutes of 100k dropped it from .36 to .34 - Still above the breakout point of .32 - intrday indicators are all near the bottom too, so my guess it is has more in it tomorrow -
Material event?
Hi 4God,
Could you take a look at APNS for me and give me your opinion?
TIA
appreciated, and welcome to the board-
4G you definitely get a member and board mark from me!
PLUG annotated chart - trendlines suggest that the swing here is getting tighter - cycle is certainly UP though at the moment.
Awesome stuff 4G!! Thanks. It's fun doing charts for people but I know it can get tiring so 1 more whenever you get the chance.
PLUG.
FCEL annotated chart:
Hey 4g, can you chart FCEL for me. Is it turning around because I know the chart looked horrible for a while there. Thanks. Hope all is well.
4G has been so awesome with TA, very good person to learn from. Between the two of us, we should write a book. :) Hi 4g! Can't sleep and I found you. :)
This is a great board, thanks so much for all the info 4Godnwv. I've always wanted to learn TA and this has been very helpful. Awesome!
thanks, no rush, but i will be looking forward to it, i will be around. PYPR all the wayyyyy :)
Actually no - I have taught that to several people via PM, but have never posted it and added it to the I-box.
I'll try to get that done this week. Thanks for the suggestion.
4God
hey 4god, im in the pypr board with you, just decided to look at your other boards. You really like to help people huh? Thats awsome... Did u ever make that article on back testing as stated below?
CTG.V, GML.V, SOEN.OB, PID.V , SRO.V === Watch for Movement This Week
CTG.V ---- Came back to life on Friday. Huge volume. The stock should get back to .30.
http://www.stockscores.com/quickreport.asp?ticker=v.ctg
GML.V ---- Volume is healthy. Stock is looking to get back to 1.25.
http://www.stockscores.com/quickreport.asp?ticker=v.gml
SOEN.OB ---- Needs to form a base in the 1.30 range to see a new run.
http://www.stockscores.com/quickreport.asp?ticker=soen
PID.V ---- Accumulate at any price below .15. The news flow is showing big progress @ the corporate level.
http://www.stockscores.com/quickreport.asp?ticker=v.pid
SRO.V ---- Volume slowed down but the story remains intact. Company has big upside.
http://www.stockscores.com/quickreport.asp?ticker=v.sro
Visit Us @ www.clarksoncapital.com
Well i'm always willing to learn something new. There is always room for more knowledge.
Thnx and welcome - Just getting started really - taking my time and getting all the sentiment stuff out of the way first (much neglected imo) - My hope is that when we start tackling the indicators folk will have a good handle on what they are really indicating.
 This board is dedicated to teaching technical analysis.
My intention is to provide a thorough examination of indicators, trendlines, patterns, candlesticks, etc., and a methodical study of their interrelations.
The theme will include market psychology and sentiment, as it is my contention that charting is a graphical representation of market sentiment using applied mathmatics to define and project both current and future tendencies, based on data that has been collected and analyzed.
Getting Started: http://investorshub.com/boards/read_msg.asp?message_id=11109508
Tools: http://investorshub.com/boards/read_msg.asp?message_id=11125264
What's the Goal?: http://investorshub.com/boards/read_msg.asp?message_id=11185134
Market Sentiment (Pt 1) Emotion: http://investorshub.com/boards/read_msg.asp?message_id=11205324
Market Sentiment (Pt 2) Crowd Behavior: http://investorshub.com/boards/read_msg.asp?message_id=11322470
Market Sentiment (Pt 3) Volume: http://investorshub.com/boards/read_msg.asp?message_id=11787652
-Coming Soon-
Candlesticks:
Trends:
Primary and secondary movements:
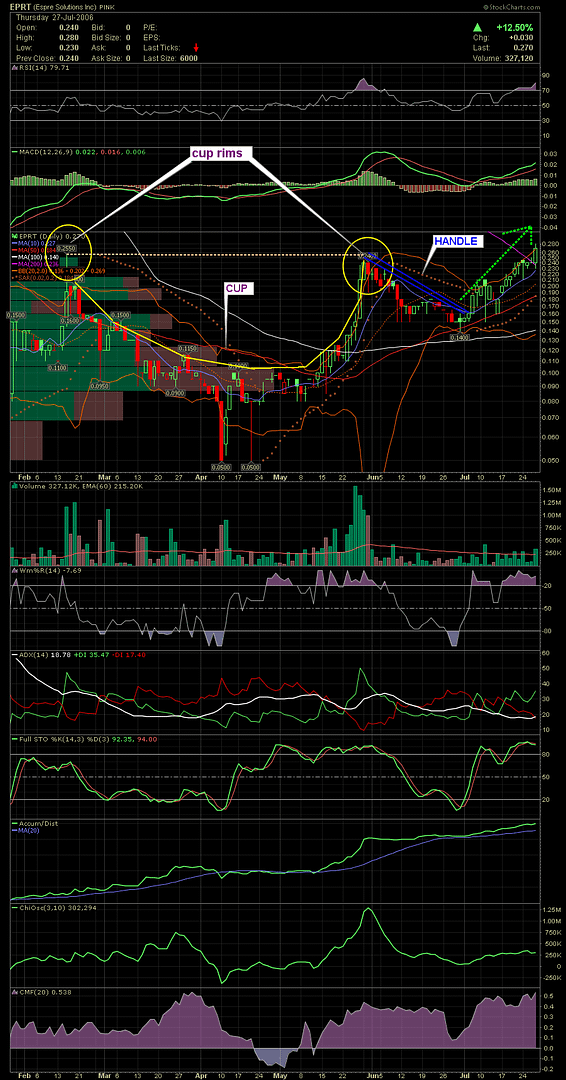
Patterns: Cup w/Handle: http://investorshub.com/boards/read_msg.asp?message_id=12298056
Drawing Trendlines:
Channels:
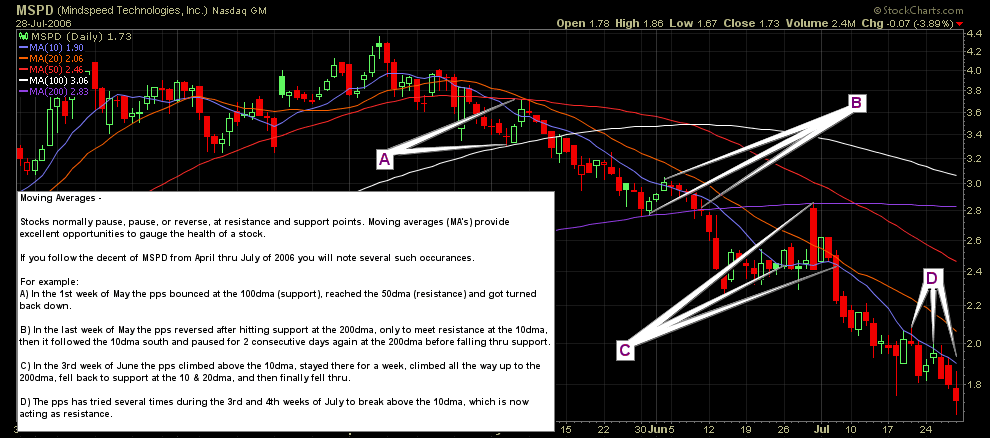
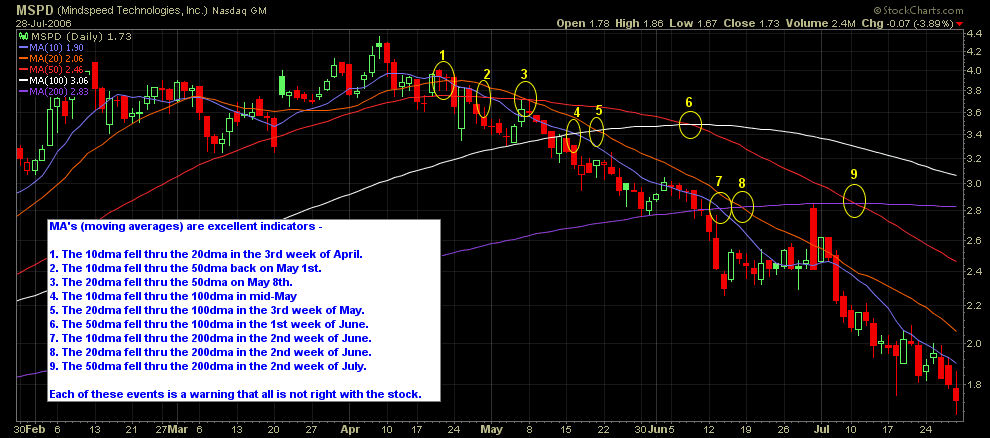
Moving Averages: (2) Charts: http://investorshub.com/boards/read_msg.asp?message_id=12323407
Support and Resistance: http://investorshub.com/boards/read_msg.asp?message_id=16231758
Indicators: Parabolic SAR: http://investorshub.com/boards/read_msg.asp?message_id=11430711
Convergence/Divergence:
I Want My Momo:
Volatility:
This board is dedicated to teaching technical analysis.
My intention is to provide a thorough examination of indicators, trendlines, patterns, candlesticks, etc., and a methodical study of their interrelations.
The theme will include market psychology and sentiment, as it is my contention that charting is a graphical representation of market sentiment using applied mathmatics to define and project both current and future tendencies, based on data that has been collected and analyzed.
Getting Started: http://investorshub.com/boards/read_msg.asp?message_id=11109508
Tools: http://investorshub.com/boards/read_msg.asp?message_id=11125264
What's the Goal?: http://investorshub.com/boards/read_msg.asp?message_id=11185134
Market Sentiment (Pt 1) Emotion: http://investorshub.com/boards/read_msg.asp?message_id=11205324
Market Sentiment (Pt 2) Crowd Behavior: http://investorshub.com/boards/read_msg.asp?message_id=11322470
Market Sentiment (Pt 3) Volume: http://investorshub.com/boards/read_msg.asp?message_id=11787652
-Coming Soon-
Candlesticks:
Trends:
Primary and secondary movements:
Patterns: Cup w/Handle: http://investorshub.com/boards/read_msg.asp?message_id=12298056
Drawing Trendlines:
Channels:
Moving Averages: (2) Charts: http://investorshub.com/boards/read_msg.asp?message_id=12323407
Support and Resistance: http://investorshub.com/boards/read_msg.asp?message_id=16231758
Indicators: Parabolic SAR: http://investorshub.com/boards/read_msg.asp?message_id=11430711
Convergence/Divergence:
I Want My Momo:
Volatility:
| Volume | |
| Day Range: | |
| Bid Price | |
| Ask Price | |
| Last Trade Time: |