 News
News  Market Data
  Discover
Support: 888-992-3836
Copyright © 2023 InvestorsHub Inc.


Register for free to join our community of investors and share your ideas. You will also get access to streaming quotes, interactive charts, trades, portfolio, live options flow and more tools.
$Ticker$ CELZ Q Out today and UP over 400% compared to las tuesday Q. Debt paid down Money Up, Cash On Hand, this is a no brainer people. But, don’t take it from me, do your own DD on the company!!Up We Go!!! :)
Bollinger bands squeeze trading board will be active now
HPTG ..Next Runner in the making!...Analyst Target Price 0.26…Company to become the world’s only high volume automotive grade manufacturer of hydrogen assisted engine systems… HPTG is looking for revenues @$150 million in the US..and $220 million in Europe ..HPTG Hydroplant certified by United nations ECE standards… Mercedez Benz interested in HPTG Patented technology… Reverse Merger in the works.. HPTG has 2 patents pending and another 2 in process.. sales already underway in the US and Europe..Negotiations underway in China..Company has Closely held manufacturing capacity to deliver initial $250M revenue..Company has Received Preliminary Grant Approval in Poland Subject to EU Final Approval for Implementation of HydroPlant(TM) on Heavy Duty Vehicles… HPTG CEO Slotkin has the Midas touch.. he headed the team that took Odyne public in October of 2006 trading on the NASDAQ symbol ODYC.BB.. HPTG CEO Transformed four operating entities from annual aggregated losses of over $75 million to profits in excess of $22 million!!!...Increased sales of lumber firm from $25 to $75 million in only three years!..HPTG’s engineering team is made up of professionals from diverse backgrounds including MIT, NASA, GE, and NASCAR …No commercially available electrolysis systems on the market comparable to the HydroPhi system...HPTG Float around 50 million..OS 202 million…HPTG is…
![]()
HydroPlant™ Awarded Certification Issued by the Director of Transportation Technical Supervision in Poland Confirming It Has Met United Nations ECE Standards
http://hydrophi.com/2015/05/04/hydroplant-awarded-certification-issued-by-the-director-of-transportation-technical-supervision-in-poland-confirming-it-has-met-united-nations-ece-standards/

Look at some of the CEO's accomplishments..

HPTG CEO Slotkin headed the team that took Odyne public in October of 2006 trading on the NASDAQ symbol ODYC.BB

Look at how the the CEO of HPTG turned around this company ..Transformed four operating entities from annual aggregated losses of over $75 million to profits in excess of $22 million!!!...Increased sales of lumber firm from $25 to $75 million in only three years!!.

HPTG is looking for revenues @$150 million in the US..and $220 million in Europe..


January 20, 2015...HydroPhi Announces Broad Transit Bus Refurbishing Program With Rutas Unidas and Mexico City..
http://2znckx1tw9kb3kqps7hbqecgc8.wpengine.netdna-cdn.com/wp-content/uploads/2015/01/Hydrophi-Press-release-Rutas-subsidy.pdf


October 29, 2014..SeeThruEquity Initiates Research Coverage on HydroPhi Technologies Group, Inc. with a Target Price of $0.26..

http://media.wix.com/ugd/a15970_2d04c2a24a8a43fda9f53442d837e812.pdf
HydroPhi’s engineering team is made up of professionals from diverse backgrounds including MIT, NASA, GE, and NASCAR. The team develops and implements applications for HydroPhi’s patented, proprietary hydrogen fuel systems.
http://www.clipular.com/c/5679665755717632.png?k=imZiim7-Rx3JOyZDBpQPrQhPBmI

HPTG..Competitive Advantage in the International Market..

This is the Video where the CEO mentioned that Mercedez Benz was interested in HPTG Technology ... watch at 10.37...


$MCP (Molycorp) 25% of float is short, up over 100% in 3 days of trading. Shorts trying to hold this down, squeeze is eminent!
Rare Earth Sector Boom!!
China abolished Rare Earth Element Export Quota's so we may not be able to import any or may be very limited. Rare earths are CRITICAL to defense and energy.
IWEB .0001 Newest CTC Customer Aviation Technical Services Shares Outstanding 492,746,383 a/o Feb 14, 2014
http://finance.yahoo.com/news/iceweb-inc-announces-newest-ctc-121800748.html
Iceweb is in three businesses:
http://www.kcnap.com
http://www.iceweb.com
http://www.ctcwi.com
These are worth more than .0001/share $$$$$$$$

$DSCR: Discovery and VPR Group Provide Update on Hemp/CBD Oil Extraction
Date : 07/22/2014 @ 9:15AM
Source : PR Newswire (US)
Stock : Discovery Minerals Ltd. (PC) (DSCR)
MARINA DEL REY, Calif., July 22, 2014 /PRNewswire/ -- Discovery Minerals LTD. (OTC Pink: DSCR) (OTC: DSCR) Discovery is pleased to provide shareholders with additional detail on the anticipated yield from the AB AGRO hemp crop harvest planted on July 1, 2014 (update video and photos are available online at: tinyurl.com/dscrhempvid). The hemp has been planted on 160 acres of land in Alberta Canada. Average yield is 1 ton per acre for hemp stalk harvested. The Company is conservatively anticipating a yield of .375 tons of stalk/stem per acre, delivering 59 tons (118,000 pounds or 53,636 kilograms) of available material for processing into concentrated CBD oil. VPR's method for processing and extraction has the potential to reduce operational costs and increase efficiency of CBD oil extraction from industrial hemp, resulting in greater yields and concentrations. The processed hemp from the harvest is anticipated to yield up to 500 kilograms of CBD oil.
The market price of pharmaceutical CBD oil today is between 20,000 and 30,000 Euro Dollars/kg, (Source: Bio-Based News, May 28, 2014, tinyurl.com/cbd-pricingeu).
VPR's processing and extraction method is designed to be mobile. This will provide access to additional supplies of hemp.
About Discovery Minerals LTD.
Discovery Minerals Ltd., (OTC PINKSHEETS: DSCR.PK) is an acquisition and development company that targets natural resource properties through its subsidiaries. These properties fall within two primary channels, precious metals/mining and industrial hemp. Discovery subsidiaries engage in activities that include the cultivation, product development, and distribution of industrial hemp; Gold, silver and precious metals. In addition, the Company is pursuing clean tech and alternative energy investments to be integrated into these business channels.
About VPR Group, Inc.
VPR Group, Inc. focuses on the production and extraction of concentrated CBD oils through a proprietary process for retail and wholesale products.
- Go DSCR
$DSCR: just finished harvest day~
$IDGC: ID Global Corporation Provides an Investment Portfolio Update
Date : 05/08/2014 @ 12:12PM
Source : PR Newswire (US)
Stock : Idglobal Corp. (PC) (IDGC)
CHICAGO, May 8, 2014 /PRNewswire/ -- ID Global Corp. (OTC: IDGC) is pleased to provide an investment portfolio update to its shareholders. This update includes new assets, adding to its current portfolio, which includes a new assignment of claims for Physicians Healthcare Management Group (OTC:PHYH):
PHYH:
Acquired $358,000 of receivables.
Sebastien DuFort, president and CEO, stated, "This asset acquisition is consistent with our new long-term strategy shared by Robert Trinka, Chairman and CEO of PHYH. We are pleased to have been able to step in and provide the assistance, for the mutual benefit of both companies."
About Physicians Healthcare Management Group, Inc.
Physicians Healthcare Management Group, Inc. (PHYH) is a holding company focusing on employing its management and capital resources in early-stage growth companies that seek to benefit from the public markets, but lack the public company management expertise and financial resources to comply with regulatory requirements of a publicly traded company, without our assistance. PHYH will target companies that have the right growth and profit characteristics covering a wide range of industries.
- Go IDGC
VPOR- Bollinger band narrowing down. I am still a newbie to trading. Can anyone tell me how to confirm uptrend or downtrend on this ticker symbl
$MTVX: APT MotoVox Wins Rookie of the Year at 2014 AIMExpo
Date : 10/20/2014 @ 10:30AM
Source : PR Newswire (US)
Stock : APT MotoVox Group, Inc. (MTVX)
KANSAS CITY, Mo., Oct. 20, 2014 /PRNewswire/ -- APT MotoVox Group, Inc. (OTC BB: MTVX) and its house of brands took last week's AIMExpo Motorsport show in Orlando, Florida by surprise, according to the show coordinators. AIM presented Troy A. Covey and APT with two awards on Sunday for "Rookie of the Year" and "Best Presentation over 400 sq ft" when judged along side some of the most successful global brands in motorsports such as Go Pro, Kawasaki, Yamaha, Suzuki, and many others. MotoVox, MotoPed and SmartCarb products were presented to thousands of consumers and to many of the nation's premier motorsport dealers throughout North America.
"The awards were certainly indicative of the dealer's and consumer's response. We had 6 to 8 sales representatives present in our booths at any given moment and still could not keep up with dealer demand," said Troy A. Covey, president of APT MotoVox Group. "Numerous international dealers told us they came from Australia, Italy, Costa Rica, Venezuela and other countries specifically to see our products and to meet with us. As I have previously stated, our challenge for 2015 will be meeting demand."
"We expected a double and maybe a triple, but we hit a home run with both dealers and consumers," said Mr. Covey. "The AIM awards were a great surprise. We owe it all to our team's long, hard work to make a creative and bold presentation."
"We'd like to thank the management and staff of the AIMExpo for welcoming us to the show and for making us all feel like family," said Mr. Covey. This was the perfect forum for our company and our industry. We are excited to return next year."
APT will present more updates throughout the week.
About APT MotoVox Group, Inc.:
APT MotoVox Group, Inc. (OTC BB: MTVX) is a Delaware registered corporation headquartered in Kansas City and is the holding company for the MotoVox® and MOTOPED® motorsport product lines, SmartCarb® patented fuel system, and the Sonic Flow small engine technology lines (www.motovox.com/, www.powerapt.com/ and http://www.motoped.com).
- Go MTVX
$UNQT: Union Equity Inc. Announces Current Status Update
Date : 04/15/2014 @ 8:15AM
Source : Marketwired
Stock : Union Equity, Inc. (PN) (UNQT)
Union Equity Inc. Announces Current Status Update
INDIANAPOLIS, IN--(Marketwired - Apr 15, 2014) - Union Equity Inc. (OTC Pink: UNQT) (PINKSHEETS: UNQT) and CEO JT Thornburg are pleased to announce new updates on acquiring current status. In accordance with the new rules and regulations handed down by the OTC, all forms and documents have been filed. All associated fees have been paid to all agencies accordingly. Corporate financials are currently in the process of being finalized. Upon completion, these will also be submitted to the OTC.
Union Equity Inc. is also pleased to announce that the short term goals and vision from the CEO remain unchanged. Mr. Thornburg and the board of directors are pleased with the recent happenings in becoming current, and look forward to finalizing this adventure. Mr. Thornburg states, "The recent events involving our company has shown me how far we have already come, and especially how far our company can go." He goes on to say, "With our board of directors, securities attorney, other personnel, and the backing of the shareholders, I feel like we can push Union Equity Inc. to the top."
Union Equity Inc. will make every attempt to provide informative press releases as information becomes available. Although news may not be available every week, Mr. Thornburg and the board of directors believe that it is important to keep the shareholders current in the recent happenings of the company. Mr. Thornburg would also like to remind the shareholders that he is always available to be contacted at his email address, jtthornburg@live.com.
Contact:
Investor Relations
Phone: 317-575-4113
Email: jtthornburg@live.com
- Go UNQT
$DSCR: Discovery's Bio-Fuel Joint Venture Acquires Exclusive License
Date : 04/29/2014 @ 8:00AM
Source : PR Newswire (US)
Stock : Discovery Minerals Ltd. (PC) (DSCR)
RENO, Nevada, April 29, 2014 /PRNewswire/ -
Discovery Minerals LTD. (OTC: DSCR) is pleased to announce that its Joint Venture (JV) with Syngar Technologies is to be extended an exclusive North American license with Cellunol Inc. The Agreement allows the JV use of Cellunol's pre-treatment Bio-Fuel fermentation technology for all Hemp Sector applications.
Cellunol Inc. was formed as a Joint Venture between ANW Inc. of South Africa and Syngar Technologies. ANW's proprietary fermentation tank design and cellulosic pre treatment technology, Oxy-Hydro Fragmentation, when coupled with Syngar's technology, known as PLUSWave, solves one of the major issues in ethanol production from cellulose. This solutions result is an industry first, low cost cellulose pre treatment and fermentation system that is portable. The system is set up directly on the growing site or near the cellulose collection point and works similar to a grain elevator.
Discovery's Joint Venture will be the first company to evaluate this ground breaking system through their Industrial Hemp JV growing partners. This new system has the ability to process any unused hemp material in one continuous procedure from pre-treatment to sugar to ethanol. The systems efficiencies will result in significantly reduced up front capital costs and lower operational expenses while enhancing ethanol yields and net revenue.
About ANW Inc.:
ANW is a private South African based company that has developed and owns a proprietary cellulose pre treatment technology and fermentation tank designs that can rapidly pre-treat cellulose materials into a slurry product suitable for fermentation by yeasts into ethanol. Their Oxy-hydro technologies can rapidly breakdown plant material without the use of stream, pressure, or dangerous acids.
About Syngar and PLUSWave:
The Company is a private Canadian company based in Edmonton, Alberta. Syngar licensed a technology, which we call "Pulsed Low Ultra Sound Wave" (PLUSWave) Technology. The PLUS Wave[TM] license is a worldwide and exclusive for application in biofuels. The PLUSWave Technology uses specific and proprietary ultrasound frequencies, at specific power levels, over set time intervals to stimulate the fermentation growth of algae, bacteria, fungus or yeast microorganisms by upwards of 30 - 50%.
About Discovery Minerals LTD.:
Discovery Minerals Ltd., (OTC: DSCR) is a production stage company formed to acquire and develop natural resource properties. Activities include gold, precious metals and petroleum minerals, including rare earth minerals production and sales. The Company initiated a new program to evaluate undervalued assets, including clean tech and alternative energy investments, for potential addition to its portfolio.
Safe Harbor: This release includes forward-looking statements within the meaning of Section 27A of the Securities Act of 1933 and Section 27E of the Securities Act of 1934. Statements contained in this release that are not historical facts may be deemed to be forward-looking statements. Investors are cautioned that forward-looking statements are inherently uncertain. Actual performance and results may differ materially from that projected or suggested herein due to certain risks and uncertainties including, without limitation, ability to obtain financing and regulatory and shareholder approval for anticipated actions.
Contact Person:
Bill McNerney
+1(310)961-4654
At: info@discoveryholdingscorp.com
- Go DSCR
$FEGR Charts >>>>>
.png)
.png)
.png)
XSNX Daily chart, sweet tight Bollinger bands here on a daily chart, looking for a nice run shortly!
PMBS Watch This One Surge $$$$$$
Awesome Opportunity To Score Big $$$$$$$$$$$$
http://www.puramedbioscience.com/
Our next pick is ILIV here at 0.0082! Tight Bollinger Bands squeeze coming!
ILIV!
massivegains10
SBDG Daily Chart / Bollie-Squeeze, Golden Cross, CMF, Accum/Dist & SAR Alert! Lol
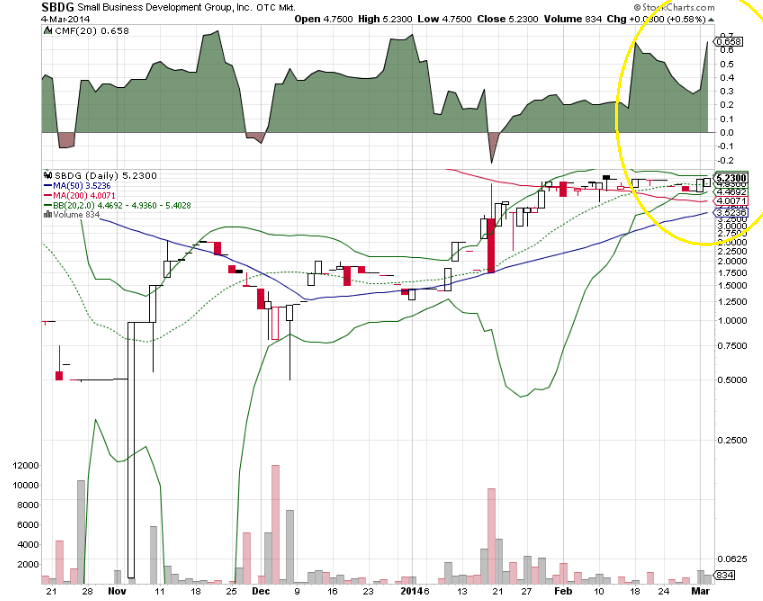
CMF & Bollie's Also Definitely Now In Play..
Accum/Dist & SAR - Rock'n! -
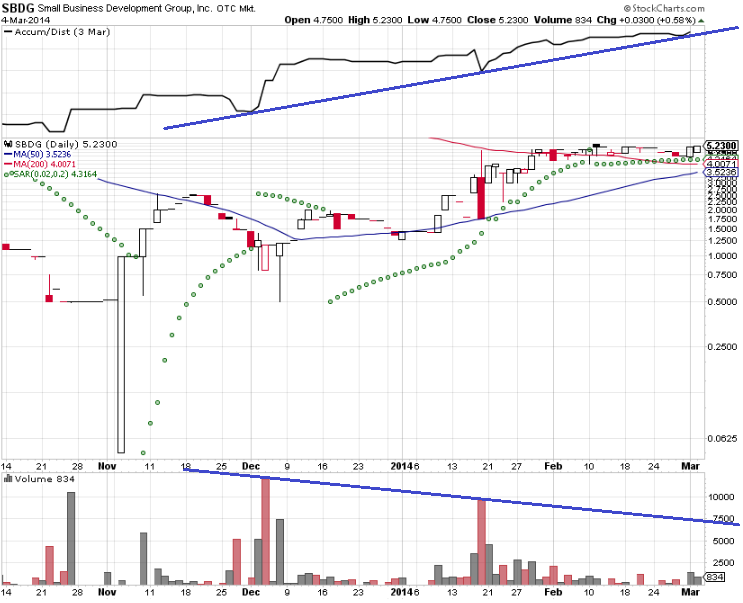
Looking For Volume Any Time Now (6 week volume cycles on chart) & Bullish 50 / 200 MA Cross Soon!
SBDG Share Structure -
Market Value1 $7,525,253 a/o Mar 03, 2014
Shares Outstanding 1,447,164 a/o Feb 24, 2014
Float 152,793 a/o Jan 13, 2014
Authorized Shares 15,000,000 a/o Sep 30, 2013
http://www.otcmarkets.com/stock/SBDG/company-info
CEO keeps shareholders well informed imo & fwiw
GBGM Is our new pick here at 0.0114! GBGM! Sweet tight Bollinger Bands!!
WOW. WNTR down to .0029-.003! I got some more .003.:)
WNTR I got more today.0047.:) loaded for bounce
WNTR. Bollies pinched tight. looks great .005/.0053:)
Chart this bullish tsxv play asw angloswiss, aswrf in the u.s. ,
http://stockcharts.com/freecharts/gallery.html?ASW.V
Wow good looking chart
Barchart says Short Term Indicators
7 Day Average Directional Indicator Buy
10 - 8 Day Moving Average Hilo Channel Buy
$ESIV
MYEC MUST READ~~~>> Edward Starrs - CEO/CFO/Chairman of the Board/Director/President, MyEcheck, Inc. Profiled on FORBES!
http://www.forbes.com/profile/edward-starrs/
Mr. Starrs has more than 20 years experience as an international business executive with management experience in multiple industries. He has been an officer and director of MyECheck since its formation in 2004. Previously, Mr. Starrs was President of Starnet Systems International, Inc., a wholly owned subsidiary of a public company that was processing more than $2 billion annually in Internet transactions. Mr. Starrs owned and operated several successful companies including, ERS Marketing, Inc., where he produced over $20 million in contracts for his clients, and Bay Distributing, Inc. a major distributor of over 800 product categories to Fortune 500 accounts. From January, 2002 through October, 2004, Mr. Starrs was President of Digency, Inc., an online payment processing company engaged in credit card and eCheck transaction processing for Internet Merchants. Starrs has also held senior management positions with Fortune 100 companies including McCaw Communications, Inc. (AT&T), and AMF, Inc., the world's largest sporting goods conglomerate. Effective May 21, 2010, the Board of Directors of the Company has appointed Edward R Starrs, the Company's Chief Executive Officer, as acting Chief Financial Officer until a suitable permanent replacement can be seated
MYEC 0039~~> Chart shows MASSIVE potential to .25++ cents which is its 200 day ma!
Wolv. im in little.008. .0099 now. .008-.0099...
Keep an eye on WOLV .0066. Bollies headed in right direction. And I'm hearing rumors of good things coming...
EXTO chart! $bollies squeezing$
About SafeCode Drug Technologies
SafeCode Drug Technologies is the developer of patent-pending technologies based on voice recognition for drug safety application.
$SAFC
WTCG daily chart
NNAN Daily Chart - Bollies are tight and MFI is way Oversold...Perfect storm brewing
CFGX Weekly chart upper bollie breakout: Chart
CFGX bollinger band squeeze + golden cross
$TERX!!! A golden cross is in the works on the chart and technicals are starting to flare up with TERX!
CFGX BB squeeze alert! Chart!
$IMNG ~ iMing Corp.
Company Overview
http://www.imingcorp.com
iMing Corp. is a provider of high-definition web based television and video's for the Chinese Market with the goal of being a leading provider of set-top boxes in Asia and expanding into North America and Europe.
Within China there is a combination of several economic revolations, the urban expansion of internet users and ecommerce, and the increase in wages and income per annum. iMing's strategy is to distribute and sell their WebTV boxes through a trillion dollar retail market, a multi-million dollar internet audience, while using low-cost local manufacturing and logistics.

FIMA - BB's just opening up today, right at the 50 day MA! Break .01 and should run. Very nice reversal of .003 today on good volume.
GL
Erik
AMBS BOLLINGER BAND SQUEEZE! ALERT OUT AT 0.091! $$$$$$$$$
|
Followers
|
87
|
Posters
|
|
|
Posts (Today)
|
0
|
Posts (Total)
|
1013
|
|
Created
|
04/13/12
|
Type
|
Free
|
| Moderator MG123 | |||
| Assistants i_like_bb_stock | |||


Bollinger bands are a very powerful technical indicator. Some traders will swear that solely trading bollinger bands is the key to their winning systems. Bollinger bands are drawn within and surrounding the price structure of a stock. It provides relative boundaries of highs and lows. The crux of the bollinger band indicator is based on a moving average that defines the intermediate term trend of the stock based on the trading timeframe you are viewing it on. This trend indicator is known as the middle band. Most stock charting applications default the middle band to a 20 period moving average. The upper and lower bands are then a measure of volatility to the upside and downside. They are calculated as two standard deviations from the middle band.
Upper Band = Middle band + 2 standard deviations
Middle Band = 20 period moving average (most charting packages use the simple moving average)
Lower Band = Middle band - 2 standard deviations.


Many of you have heard of traditional patterns of technical analysis such as double tops, double bottoms, ascending triangles, symmetrical triangles, head and shoulders top or bottom, etc. The bollinger bands indicator can add that extra bit of firepower to your analysis. They can help you understand certain characteristics of a stock such as the high or low of the day, whether or not the stock is trending, or even if it is volatile or not. On occasion when trading the bollinger bands, you will see the bands coiling very tightly which indicates the stock is trading in a narrow range. This is the trigger to watch for a price breakout or breakdown. Many times, large rallies begin from low volatility ranges. When this happens, it is referred to as "building cause". This is the calm before the storm.
A common bollinger band strategy involves a double bottom setup. The initial bottom of this formation tends to have strong volume and a sharp price pullback that closes outside of the lower Bollinger band. These types of moves typically lead to what is called an "automatic rally". The high of the automatic rally tends to serve as the first level of resistance in the base building process that occurs before the stock moves higher. After the rally commences, the price attempts to retest the most recent lows that have been set in order to test the vigor of the buying pressure that came in at that bottom. Many bollinger band technicians look for this retest bar to be inside the lower band. This indicates that the downward pressure in the stock has subsided and that there is a shift now from sellers to buyers. Also pay close attention to the volume, you need to see it drop off dramatically.
| Volume | |
| Day Range: | |
| Bid Price | |
| Ask Price | |
| Last Trade Time: |


